Figure 1.
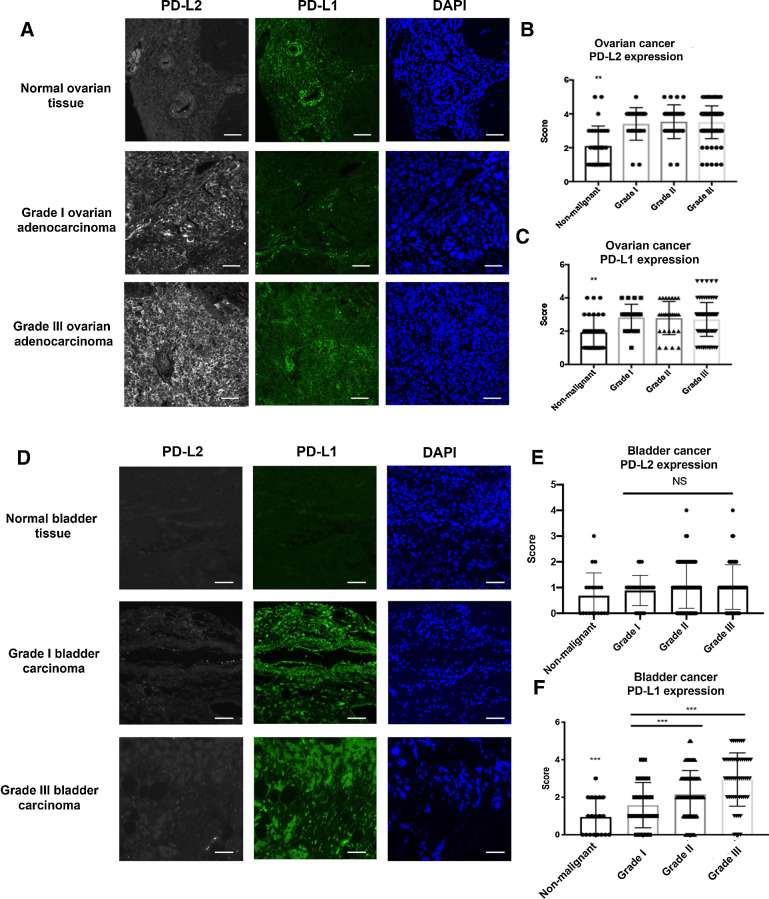
PD-L2 and PD-L1 expression in ovarian and bladder cancer. A, Representative images of ovarian cancer tissue microarray containing both normal and malignant samples (N = 156) stained with anti-human PD-L2 (gray), anti-human PD-L1 (green), and DAPI (blue) by fluorescent IHC. Scale bar 50 μm. The intensity of PD-L2 (B) and PD-L1 (C) were scored and stratified according to tumor grades. D, Bladder cancer tissue microarray was stained with anti-human PD-L2 (gray), anti-human PD-L1 (green), and DAPI (blue) by fluorescent IHC with representative images shown (N = 208). Scale bar 50 μm. E, PD-L2 expression in bladder cancer TMAs were scored and quantified according to tumor grade. F, PD-L1 expression in bladder cancer TMAs were scored and quantified according to tumor grade. Quantification data were plotted with mean and SD calculated. One-way ANOVA was used for analysis comparing the tumor grades. *, P < 0.05; **, P < 0.01; and ***, P < 0.001.

