. 2021 Jun 4;20(8):1469–1480. doi: 10.1158/1535-7163.MCT-20-0887

Figure 4.

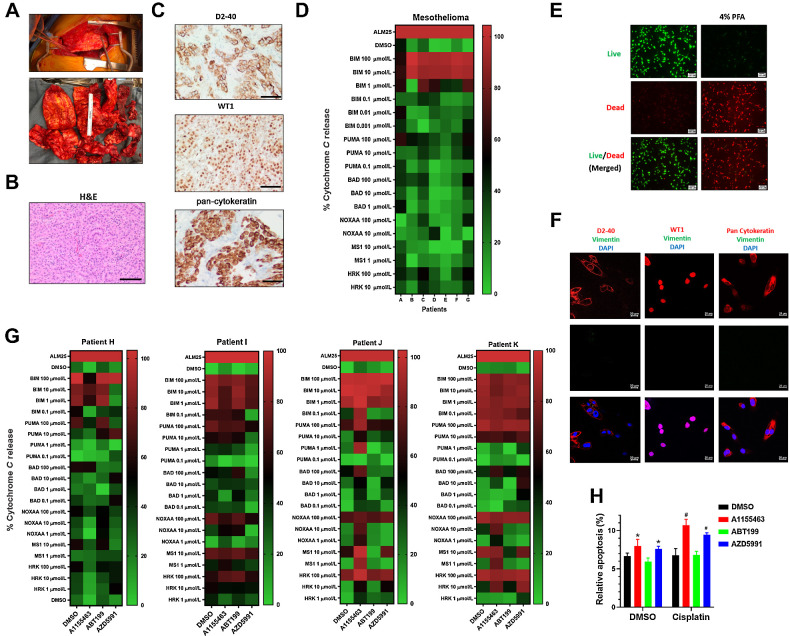
Figure 4. DBP in mesothelioma tumor specimens reveals patient-specific responses. A, Top, shows gross findings of the MPM during surgery. Bottom, shows the appearance of mesothelioma once removed. B, H&E staining of the resected specimen shows epithelioid component with tubule formation and solid architecture (scale bar  = 200 μmol/L). C, Representative results of D2-40, pan-cytokeratin, and WT1 IHC staining on MPM specimens establish the diagnosis and correlate to surface markers used for FACS analysis (scale bar  = 200 μmol/L). D, Heatmap showing BH3 profiling in seven patients reveal patient-specific profiles. E, A LIVE/DEAD assay performed in ex vivo cultured tumor cells after surgery 48 hours with 4% PFA fixed cells for positive control. Green fluorescence denotes viable cells stained with calcein-AM, while reddish-orange fluorescence represents dead cells stained with ethidium homodimer. F, Immunofluorescence double staining of pan-cytokeratin, D2-40, and WT1 (red) and vimentin (green) in ex vivo cultured patient K tumor cells (scale bar  = 200 μmol/L). G, DBP performed in four patient tumors with 0.2 μmol/L A1155463, AZD5991, and ABT-199 for 20 hours ex vivo. H, An annexin V assay reveals that pretreatment with 0.2 μmol/L A1155463, AZD5991, and ABT199 for 24 hours prior to 48 hours of CDDP treatment primed the mitochondria as noted by the apoptotic ratios. Cells positive for annexin V staining were counted as apoptotic cells (*, P < 0.05 for treatment vs. DMSO; #, P < 0.05 for combination treatment vs. A1155463, ABT-199 or S63845 single treatment).

DBP in mesothelioma tumor specimens reveals patient-specific responses. A, Top, shows gross findings of the MPM during surgery. Bottom, shows the appearance of mesothelioma once removed. B, H&E staining of the resected specimen shows epithelioid component with tubule formation and solid architecture (scale bar  = 200 μmol/L). C, Representative results of D2-40, pan-cytokeratin, and WT1 IHC staining on MPM specimens establish the diagnosis and correlate to surface markers used for FACS analysis (scale bar  = 200 μmol/L). D, Heatmap showing BH3 profiling in seven patients reveal patient-specific profiles. E, A LIVE/DEAD assay performed in ex vivo cultured tumor cells after surgery 48 hours with 4% PFA fixed cells for positive control. Green fluorescence denotes viable cells stained with calcein-AM, while reddish-orange fluorescence represents dead cells stained with ethidium homodimer. F, Immunofluorescence double staining of pan-cytokeratin, D2-40, and WT1 (red) and vimentin (green) in ex vivo cultured patient K tumor cells (scale bar  = 200 μmol/L). G, DBP performed in four patient tumors with 0.2 μmol/L A1155463, AZD5991, and ABT-199 for 20 hours ex vivo. H, An annexin V assay reveals that pretreatment with 0.2 μmol/L A1155463, AZD5991, and ABT199 for 24 hours prior to 48 hours of CDDP treatment primed the mitochondria as noted by the apoptotic ratios. Cells positive for annexin V staining were counted as apoptotic cells (*, P < 0.05 for treatment vs. DMSO; #, P < 0.05 for combination treatment vs. A1155463, ABT-199 or S63845 single treatment).