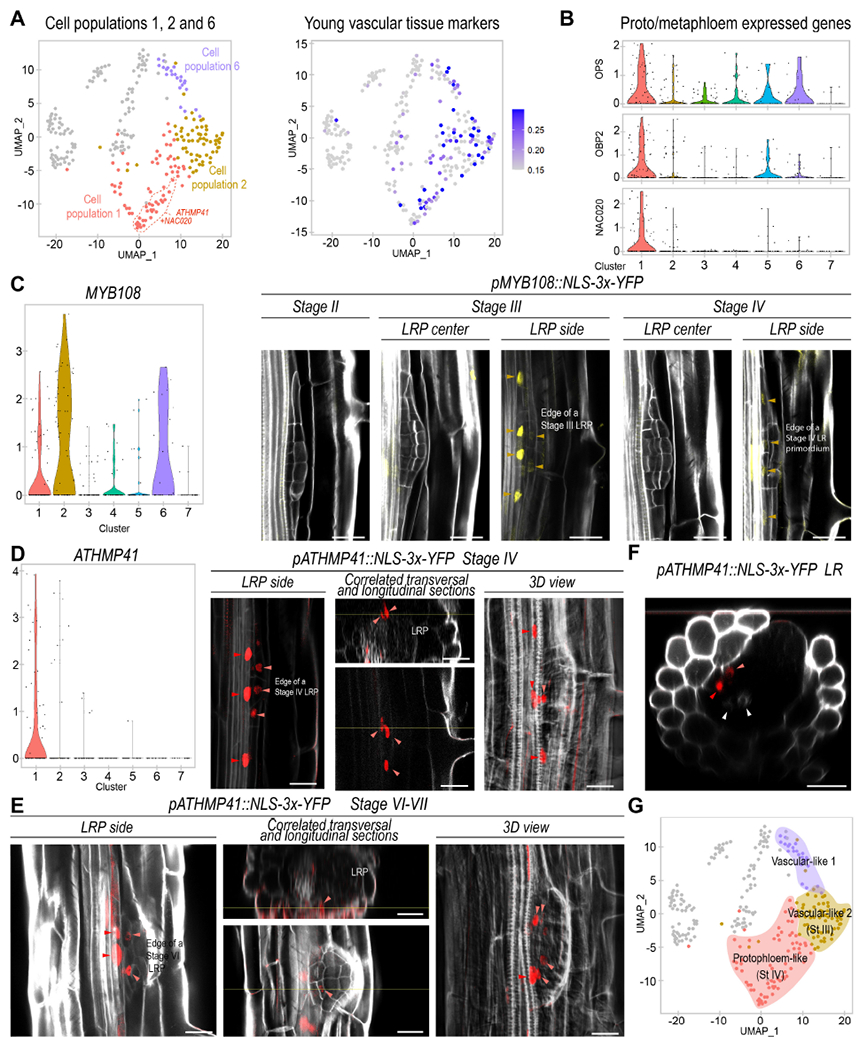
Figure 3. Different LRP cell populations show characteristic gene expression associated to vasculature development and one of them defines the cells adjacent to the phloem tissues of the primary root.

(A) Left, UMAP plot showing cell populations 1, 2 and 6 coded by colors. Cells with enriched expression of the population 1 biomarkers ATHMP41 and NAC020 are surrounded by a dashed red line Center, UMAP representation of the average expression of young vascular tissue markers. (B) Violin plot showing the average expression of protophloem and metaphloem representative genes: OCTOPUS (OPS), OBP2 and NAC020. (C) Left, violin plot showing expression of MYB108. Right, confocal images showing expression of pMYB108:NLS-3xYFP (in yellow) in a LRP (LRP) at stages II to IV. Orange arrows: pMYB108 marked cells. (D) Left, violin plot showing expression of ATHMP41. Right, confocal images showing expression of pATHMP41:NLS-3xYFP (in red) at stage IV of LR formation. (E-F) Images showing expression of pATHMP41:NLS-3xYFP during LR formation (D) and in a recently emerged LR (E). (D-F) Light red arrowheads: cells inside the LRP. Red arrowheads: primary root phloem. White arrowheads: primary root xylem. Stained cell walls are shown in a gray scale. Scale bars: 25 μm. (G) UMAP plot defining populations 6, 2 and 1 as vascular-like and protopholem-like cells on colored backgrounds.
