Figure 1.

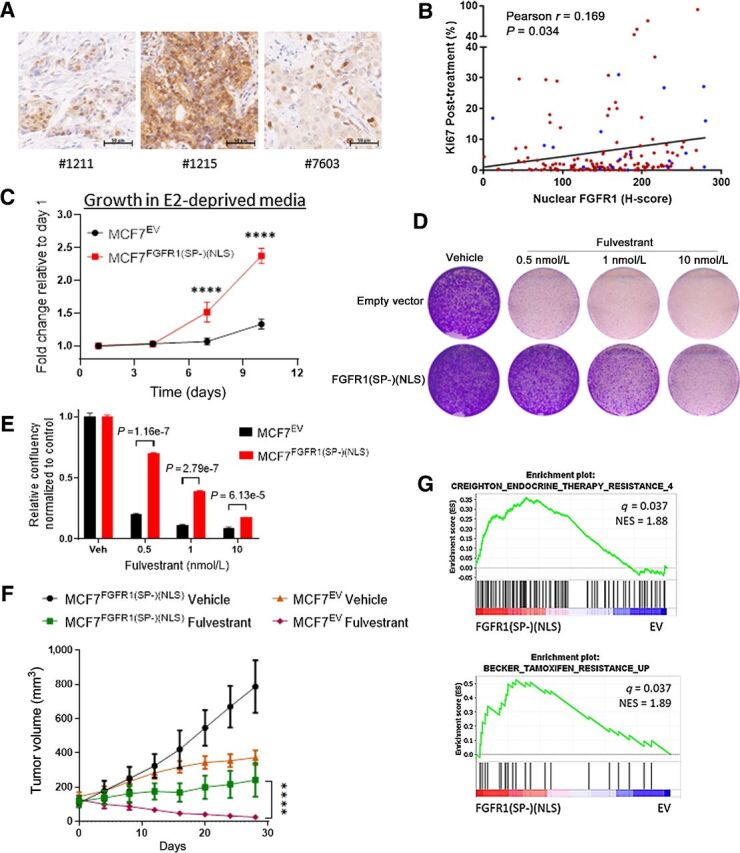
Nuclear FGFR1 promotes antiestrogen resistance. A, Sections of FFPE of ER+/FGFR1-amplified breast primary tumors were subjected to IHC with an FGFR1 antibody as described in the Methods. B, Plot showing direct correlation between nuclear FGFR1 H-Score, measured by IHC, and posttreatment Ki67 in 155 ER+/HER2− breast cancer biopsies from women treated with preoperative letrozole for 10–21 days in the NCT00651976 trial (12, 24). In blue, samples exhibiting FGFR1 amplification (n = 19/155), defined as an FGFR1:CEN8 ratio ≥2.0. C, MCF-7EV and MCF-7FGFR1(SP-)(NLS) cells were seeded in 6-well plates in estrogen-deprived medium. Medium was replenished every 72 hours. Monolayers were stained with crystal violet on days 1, 4, 7, and 10. Quantification of the integrated intensity values as fold change normalized to day 1 (Sidak multiple comparisons test, two-way ANOVA, **** P < 0.0001). D, MCF-7EV and MCF-7FGFR1(SP-)(NLS) cells were seeded in 6-well plates in full medium and treated with vehicle (DMSO) or fulvestrant. After seven days, monolayers were stained with crystal violet. E, Quantification of the integrated intensity values as fold change normalized to vehicle-treated controls (multiple Student t test). F, MCF-7EV and MCF-7FGFR1(SP-)(NSL) xenografts were established in ovariectomized athymic mice implanted with a subcutaneous 14-day release, 0.17-mg 17β-estradiol pellet. Once tumors established, mice were randomized to treatment with vehicle or fulvestrant (5 mg/week). Each data point represents the mean tumor volume in mm3 ± SEM (n = 8 per arm, ****P < 0.0001; two-way ANOVA). G, GSEA of RNA-Seq data for MCF7FGFR1(SP-)(NLS) versus MCF7EV, showing enrichment of gene sets associated with antiestrogen resistance in MCF7FGFR1(SP-)(NLS) cells.
