Figure 3.

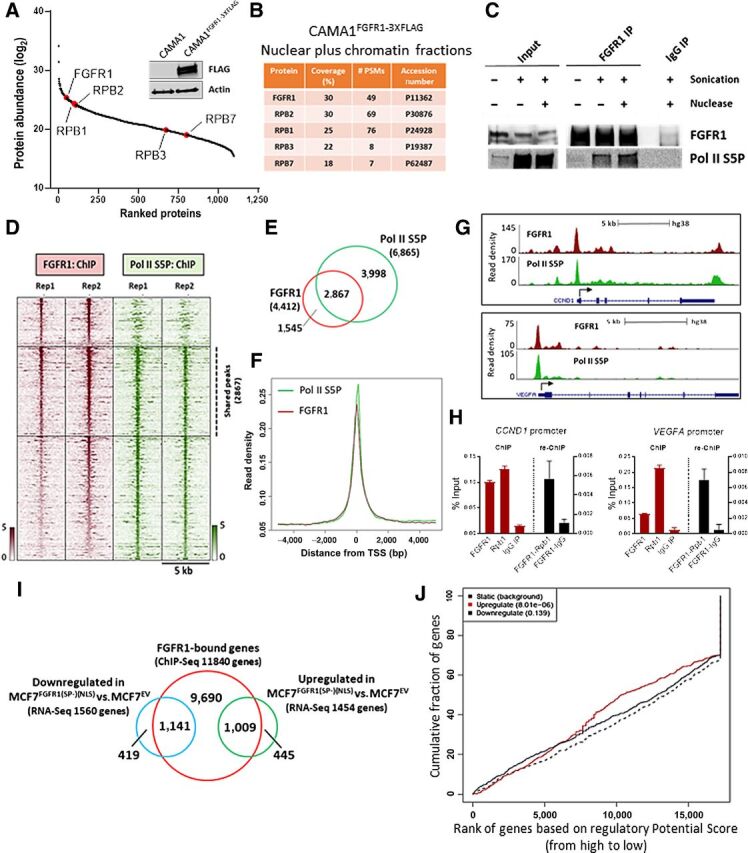
FGFR1 associates with RNA polymerase II and promotes gene expression. A, FLAG-immunoprecipitation followed by MS was performed on sonicated and nuclease-treated mixed nuclear and chromatin fractions of CAMA1FGFR13XFLAG cells. FGFR1 and RNA Polymerase II subunits are highlighted (red). The Western blot on the right shows FLAG-FGFR1 overexpression in CAMA1FGFR13XFLAG cells. B, List of RNA polymerase II subunits that coprecipitate with FLAG-FGFR1. Coverage (%) indicates the percentage of the protein sequence that was covered by the identified peptides. #PSMs indicates the number of Peptide Spectrum Matches or the number of spectra assigned to peptides that contributed to inference of the protein. C, Coprecipitation of FGFR1 and RNA Polymerase phosphorylated on Serine residue 5 (Pol II S5P), with or without sonication and nuclease treatment. D, Heatmaps of ChIP-seq read densities around the FGFR1 (red) and Pol II S5P bound regions (green) in CAMA1 cells. E, Venn diagram and (F) density plots related to FGFR1- and Pol II S5P-ChIP-seq shown in D. G, Distribution of FGFR1 and Pol II S5P binding peaks at the VEGFA and CCND1 promoters (UCSC genome browser). H, ChIP-reChIP assay performed by sequential ChIP-qPCR with an FGFR1 antibody followed by an antibody against Pol II S5P (Rpb1) or normal rabbit IgG (control), at the VEGFA and CCND1 promoters. Enrichment values expressed as percent (%) of input. I, Venn diagram of FGFR1-bound genes by ChIP-seq in MCF7FGFR1(SP-)(NLS) cells (red circle), and genes upregulated (green), and downregulated (blue) in MCF7FGFR1(SP-)(NLS) versus MCF7EV cells. J, Prediction of activating or repressing transcription function of FGFR1 by Binding and Expression Target Analysis (BETA). ChIP-Seq and RNA-seq data from I were integrated. Genomic regions bound by FGFR1 are predicted to regulate the expression of upregulated genes, but not of downregulated genes. P values indicate the significance of the associations compared with background nonregulated genes.
