. 2021 May 19;27(15):4379–4396. doi: 10.1158/1078-0432.CCR-20-3905

Figure 4.

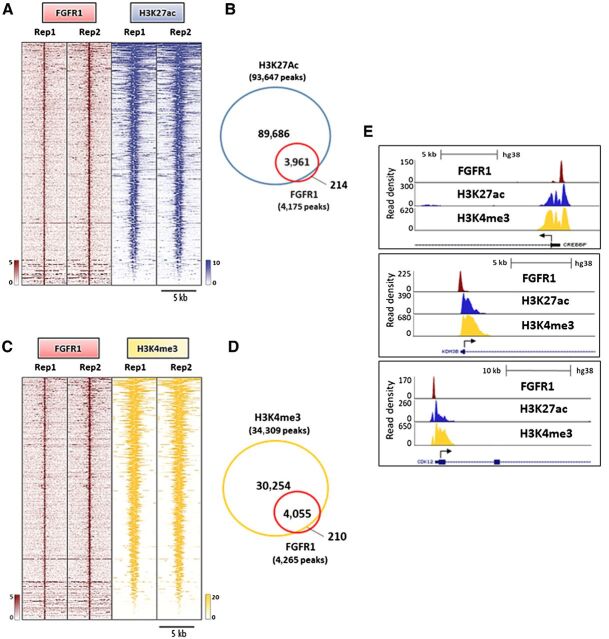
Figure 4. Nuclear FGFR1 overlaps with active transcription histone marks. A, Heatmaps of ChIP-seq read densities around the FGFR1-bound regions (red) and areas of increased acetylation of H3K27 (H3K27ac, blue) in CAMA1 cells. Two replicates for each antibody are shown. B, Venn diagram of FGFR1 ChIP-Seq peaks and H3K27ac regions. C, Heatmaps of ChIP-Seq read densities around the FGFR1-bound regions (red) and areas of increased trimethylation of H3K4 (H3K4me3; yellow) in CAMA1 cells. Two replicates for each antibody are shown. D, Venn diagram of FGFR1 ChIP-Seq peaks and H3K4me3 regions. E, Distribution of FGFR1-binding peaks, H3K27ac and H3K4me3 histone marks at the CREEBP, KDM4B, and CDK12 promoters (UCSC genome browser).

Nuclear FGFR1 overlaps with active transcription histone marks. A, Heatmaps of ChIP-seq read densities around the FGFR1-bound regions (red) and areas of increased acetylation of H3K27 (H3K27ac, blue) in CAMA1 cells. Two replicates for each antibody are shown. B, Venn diagram of FGFR1 ChIP-Seq peaks and H3K27ac regions. C, Heatmaps of ChIP-Seq read densities around the FGFR1-bound regions (red) and areas of increased trimethylation of H3K4 (H3K4me3; yellow) in CAMA1 cells. Two replicates for each antibody are shown. D, Venn diagram of FGFR1 ChIP-Seq peaks and H3K4me3 regions. E, Distribution of FGFR1-binding peaks, H3K27ac and H3K4me3 histone marks at the CREEBP, KDM4B, and CDK12 promoters (UCSC genome browser).