Figure 5.

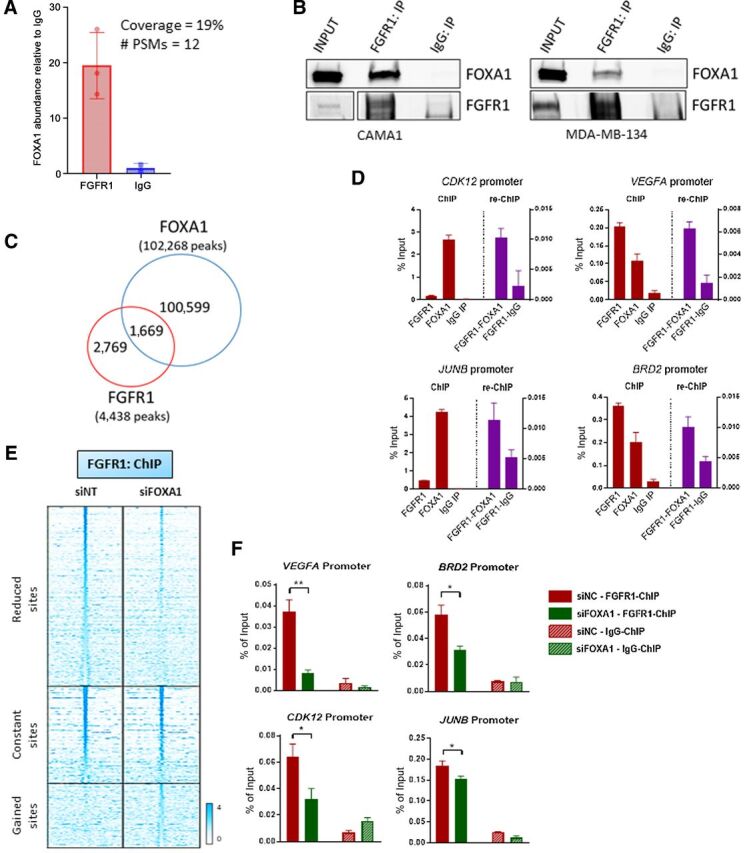
FOXA1 mediates FGFR1 recruitment to chromatin. A, Immunoprecipitation of FLAG-FGFR1 followed by mass spectrometry was conducted on mixed nuclear plus chromatin-bound fractions of CAMA13XFLAG-FGFR1 cells. The plot shows the enrichment of FOXA1 in the FLAG-FGFR1-bound fraction compared to IgG control. B, Coprecipitation of FGFR1 and FOXA1, followed by Western blot analysis, in CAMA1 (left) and MDA-MB-134 (right) cells. C, Venn diagram of FGFR1 peaks (red circle), identified by ChIP-seq (in Fig. 2A) and FOXA1 DNA–binding loci identified by ChIP-Seq (blue circle) in CAMA1 cells. D, ChIP-reChIP assay performed by sequential ChIP-qPCR with a FGFR1 antibody followed by an antibody against FOXA1 or normal rabbit IgG, at the BRD2, CDK12, VEGFA, and JUNB promoters. Enrichment values expressed as percent (%) of input. E, Heatmaps of ChIP-seq read densities around the FGFR1 bound regions in CAMA1 cells transfected with nontargeting (siNT) or FOXA1 siRNAs. Twenty-four hours posttransfection, dishes were replenished with IMEM/10% CSS, and cells were collected 48 hours later for ChIP. F, ChIP-qPCR confirmation of reduced FGFR1 binding at selected genomic loci, VEGFA (t test, P = 0.0071), BRD2 (P = 0.0145), CDK12 (P = 0.0114), JUNB (P = 0.0252) promoters, upon siRNA-mediated FOXA1 knockdown in CAMA1 cells. Enrichment values expressed as percent (%) of input.
