Figure 6.

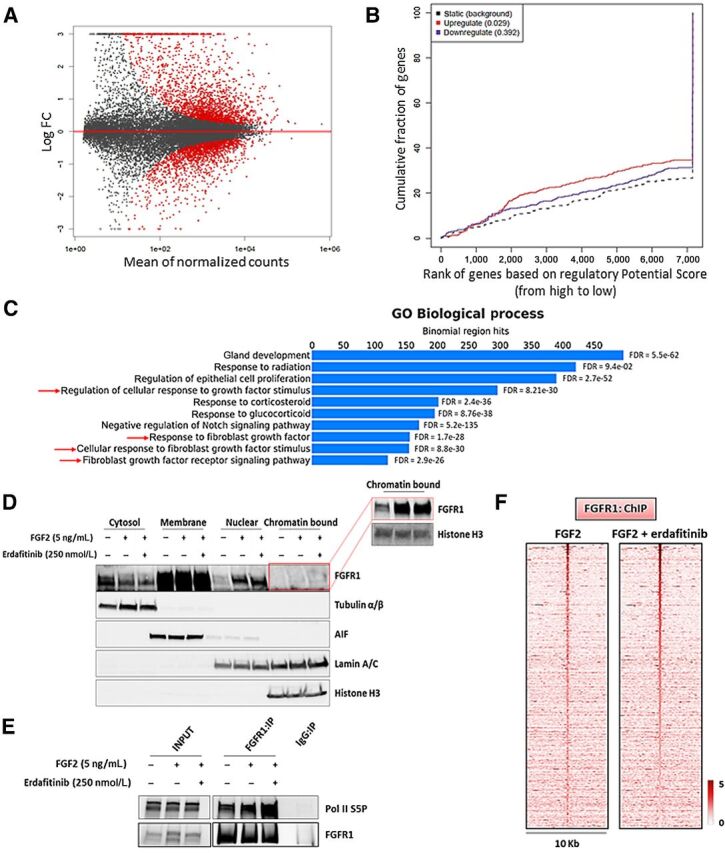
Nuclear FGFR1 activity is enhanced by FGF2 but not affected by RTK blockade. A, MA plot of M (log ratio) versus A (log mean average) normalized counts, showing differentially expressed genes with P <1e-5 in response to FGF2 (5 ng/mL, 6 hours). B, Prediction of activating or repressing transcription function of FG2-stimulated FGFR1 by BETA platform. FGFR1 ChIP-seq results from CAMA1 cells stimulated with FGF2 (5 ng/mL, 3 hours) and RNA-seq data from A were integrated. Genomic regions bound by FGFR1 are predicted to modulate expression of genes upregulated upon FGF2 stimulation, but not downregulated genes; P values indicate the significance of the associations compared with background nonregulated genes. C, GREAT analysis the FGFR1 DNA–binding sites identified by FGFR1 ChIP-seq in CAMA1 cells stimulated with FGF2 (5 ng/mL, 3 hours). Top ten enriched Gene Ontology (GO) Biological Processes and binomial FDR values are shown. D, Subcellular fractionation on CAMA1 cells, showing FGFR1 in cytosolic, membrane, soluble nuclear, and chromatin-bound compartments, after treatment with FGF2 (5 ng/mL, 3 hours) ± erdafitinib (250 nmol/L, 3 hours). Red box shows longer exposure. E, Coprecipitation of FGFR1 and Pol II S5P from sonicated and nuclease-treated lysates of CAMA1 cells ± FGF2 (5 ng/mL, 3 hours) ± erdafitinib (250 nmol/L, 3 hours). F, Heatmaps of ChIP-seq read densities around the FGFR1-bound regions in CAMA1 cells treated with FGF2 (5 ng/mL, 3 hours) ± erdafitinib (250 nmol/L, 3 hours).
