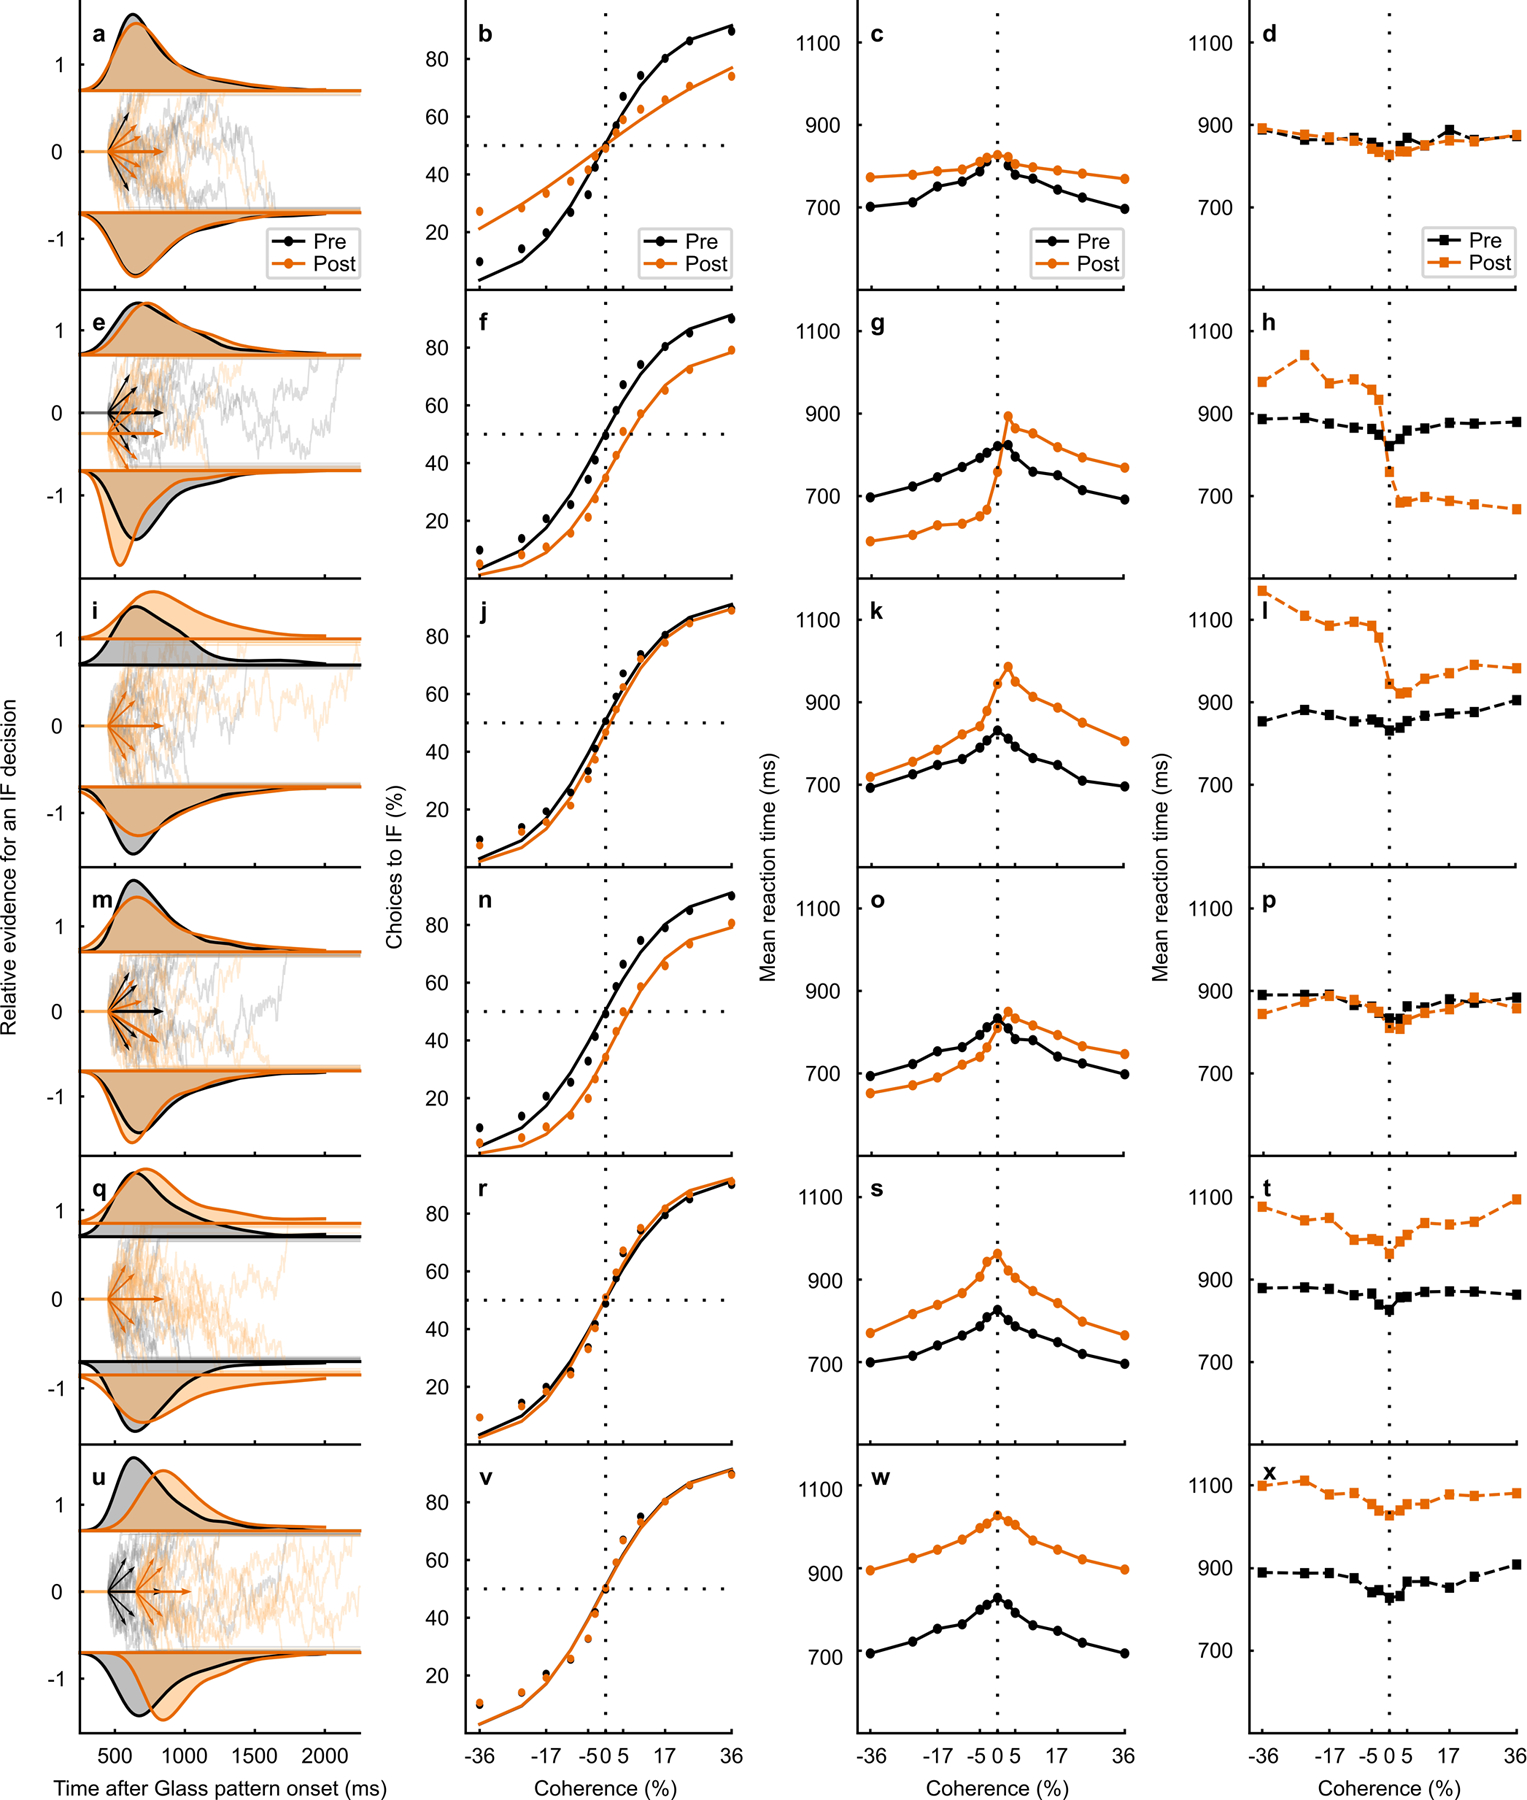
Extended Data Fig. 5. DDM model simulations for changes in model parameters.

(Associated with Fig. 4 and 5 of the main text). Panels a-p are the same as those shown in Fig. 5 of the main text. a RT distribution from the 0% coherence condition (density approximated through kernel smoothing) predicted by a DDM simulation with only decrease in proportionality factor between coherence and drift rate post-muscimol (orange). Pre-muscimol shown in black. Below the RT distributions, the relative evidence for toIF decisions is plotted over time since the Glass pattern onset and the short arrows show drift rates for toIF decisions (positive) and awayIF decisions (negative) pre- and post-muscimol, for the 0%, 10%, and 36% coherence conditions. The longer arrows show the mean drift rate across both toIF and awayIF directions and all coherences, termed drift rate offset28 b The psychometric function, plotted as a proportion of toIF choices over coherences, predicted by the DDM variant simulation with a decrease in proportionality factor between coherence and drift rate which changes the slope (without a shift) of the psychometric function. A change in the slope of the psychometric function was not observed in the data (Fig. 5r, v, shaded), making the decrease in proportionality factor between coherence and drift rate an unlikely explanation for the observed data. c Mean RT predictions for correct trials for each coherence condition for the DDM simulation with a decrease in proportionality factor between coherence and drift rate, for pre- (black) and post-muscimol (orange). d Same as in c but for error trials. e–h Same as in a-d but for the DDM variant simulation with only a change in proportional start-point of the evidence accumulation path away from the IF (often interpreted as an initial bias away from the IF). A decrease in proportional start point away from the IF predicts a shift in the psychometric function as observed in the real data (Fig. 5r,v, shaded), making a change in the proportional start point a possibility in explaining the decision bias we observed in the post-muscimol data. However, a start point change away from the IF also predicts a decrease in error toIF RTs which we did not observe in the data (Fig. 5t,x, shaded). i–l Same as in a-d but for the DDM variant with an increase in the upper boundary but no absolute start point change (start point proportionally decreased away from the IF). This parameter change also predicts a lateral shift in the psychometric function away from IF decisions as we observed in the data (Fig. 5r,v, shaded). However, this parameter change cannot explain the magnitude of the psychometric function shift we observed (Fig. 5r,v, shaded) with similar changes in simulated and observed mean RTs (Fig. 5s,t,w,x, shaded). m–p Same as in a-d but for the DDM variant with a change in drift rate offset favoring awayIF decisions. The psychometric function predictions of the model simulation with a change in the drift rate offset predict a lateral shift in the psychometric function that is observed in the data (Fig. 5r,v, shaded). The increases in correct mean RT for toIF decisions are predicted and shown for both monkeys (Fig. 5s,w, shaded). Overall, a change in drift rate offset is most likely to explain the data we obtained after muscimol inactivation of the SC. q–t Same as in a-d but for the DDM model variant that describes RT distributions and performance with only an increase in the symmetric boundaries. This parameter change predicts only slight steepening of the slope of the psychometric function and no changes in the shift of the psychometric function as observed in the data (Fig. 5r,v, shaded), making the symmetric boundary change an unlikely possibility for explaining the effects of SC inactivation. u–x Same as in a-d but for the DDM variant that describes RT distributions and performance with only an increase in non-decision time. Non-decision time changes do not explain any changes in performance and thus cannot explain a shift in the psychometric function observed in the data from both monkeys (Fig. 5r,v, shaded), making a change in non-decision time unlikely to explain the effects of SC inactivation on decision-making.
