
Extended Data Fig. 7. Model predictions versus data for RT distributions and psychometric functions.
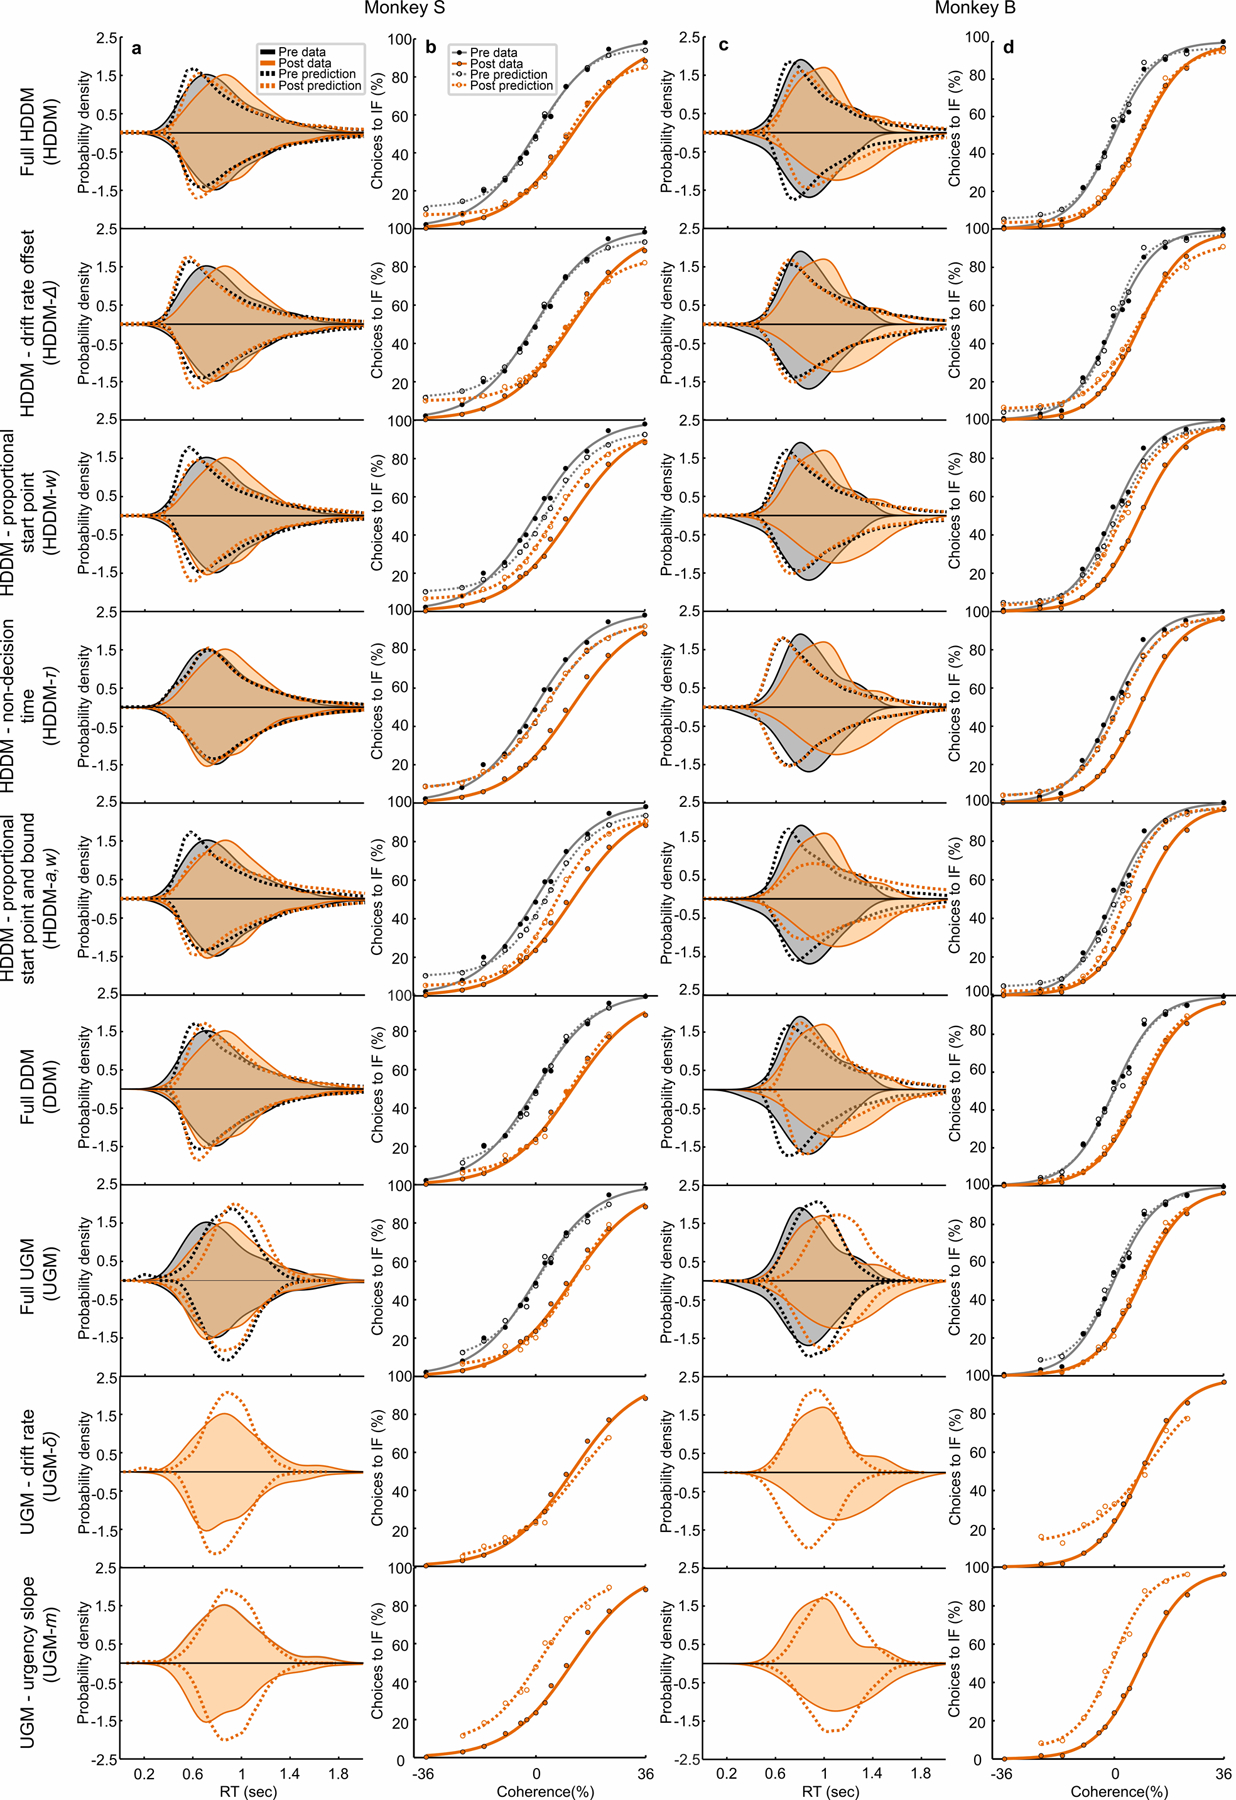
(Associated with Fig. 5 of the main text). Column a shows the predicted RT distributions (0% coherence, density approximated through kernel smoothing) from the DDM, HDDM and UGM model variants (dashed lines) together with the actual data (solid lines), pre-muscimol (black) and post-muscimol (orange), for monkey S. We observed a rightward skew of the RT distribution, consistent with a fixed bound model of decision-making and captured by the DDM rather than the UGM as was also indicated by the R2pred, AIC, and BIC goodness of fit values (Supplementary Table 4). Column b shows the same as in a but for psychometric functions (performance data, four parameter logistic model using equation shown in Extended Data Fig. 2). Column c shows the same as in a for monkey B’s data and model fits. The RT distributions from monkey B were more normally distributed compared to the skewed RT distributions of monkey S, suggesting that the UGM rather than the DDM would explain monkey B’s data, consistent with the goodness of fit values (Supplementary Table 4). Column d shows the same as in c but for psychometric function (performance data). Each row indicates the results of each model’s prediction compared to data for both monkey S and monkey B. The models from top to bottom are the full HDDM, HDDM with a free-to-vary drift rate offset (HDDM-Δ), HDDM with a free-to-vary proportional start point (HDDM-w), HDDM with free-to-vary non-decision time (HDDM-τ), HDDM with both a proportional start point and bound free to vary (HDDM-a,w), the non-hierarchical DDM, the full UGM, the UGM with free-to-vary drift rates (UGM-δ), and UGM with a free-to-vary urgency slope (UGM-m). Note that only the post-muscimol data are shown for the UGM with a single free parameter since we only fit the post data with those models where we let only one parameter free to vary while the rest of the parameters were fixed to pre-muscimol parameter estimates (Supplementary Note). Also for the DDM and UGM fits, note that there are only 11 conditions (−24 to 24 % coherence) for the psychometric functions because only 11 conditions were fitted (Supplementary Note). For the HDDM, out of all the variants (first five rows), the full HDDM predictions visually match the data for both performance and RT. The prediction of the HDDM-Δ captures the decision bias from the data almost equally well for both monkeys. The prediction for the HDDM-w and HDDM-a,w also predicts a decision bias, but is insufficient to explain the magnitude of the shift in decision bias that we observed in the data. The HDDM-τ fails to capture any decision bias (RT and performance predictions for pre and post are overlapping). The predictions of the simple DDM also capture the 0% RT distribution well, more so for monkey S than for monkey B, and also capture the choice data well. The opposite is true for the full UGM predictions, where the RT predictions capture monkey B’s data more than monkey S (see goodness of fit values in Supplementary Table 4), but also captures performance data well for both monkeys. The UGM-δ captures the shift in decision bias from the post-muscimol data from both monkeys, consistent with the findings from the HDDM, whereas the UGM-m fails to capture the decision bias in the post data.