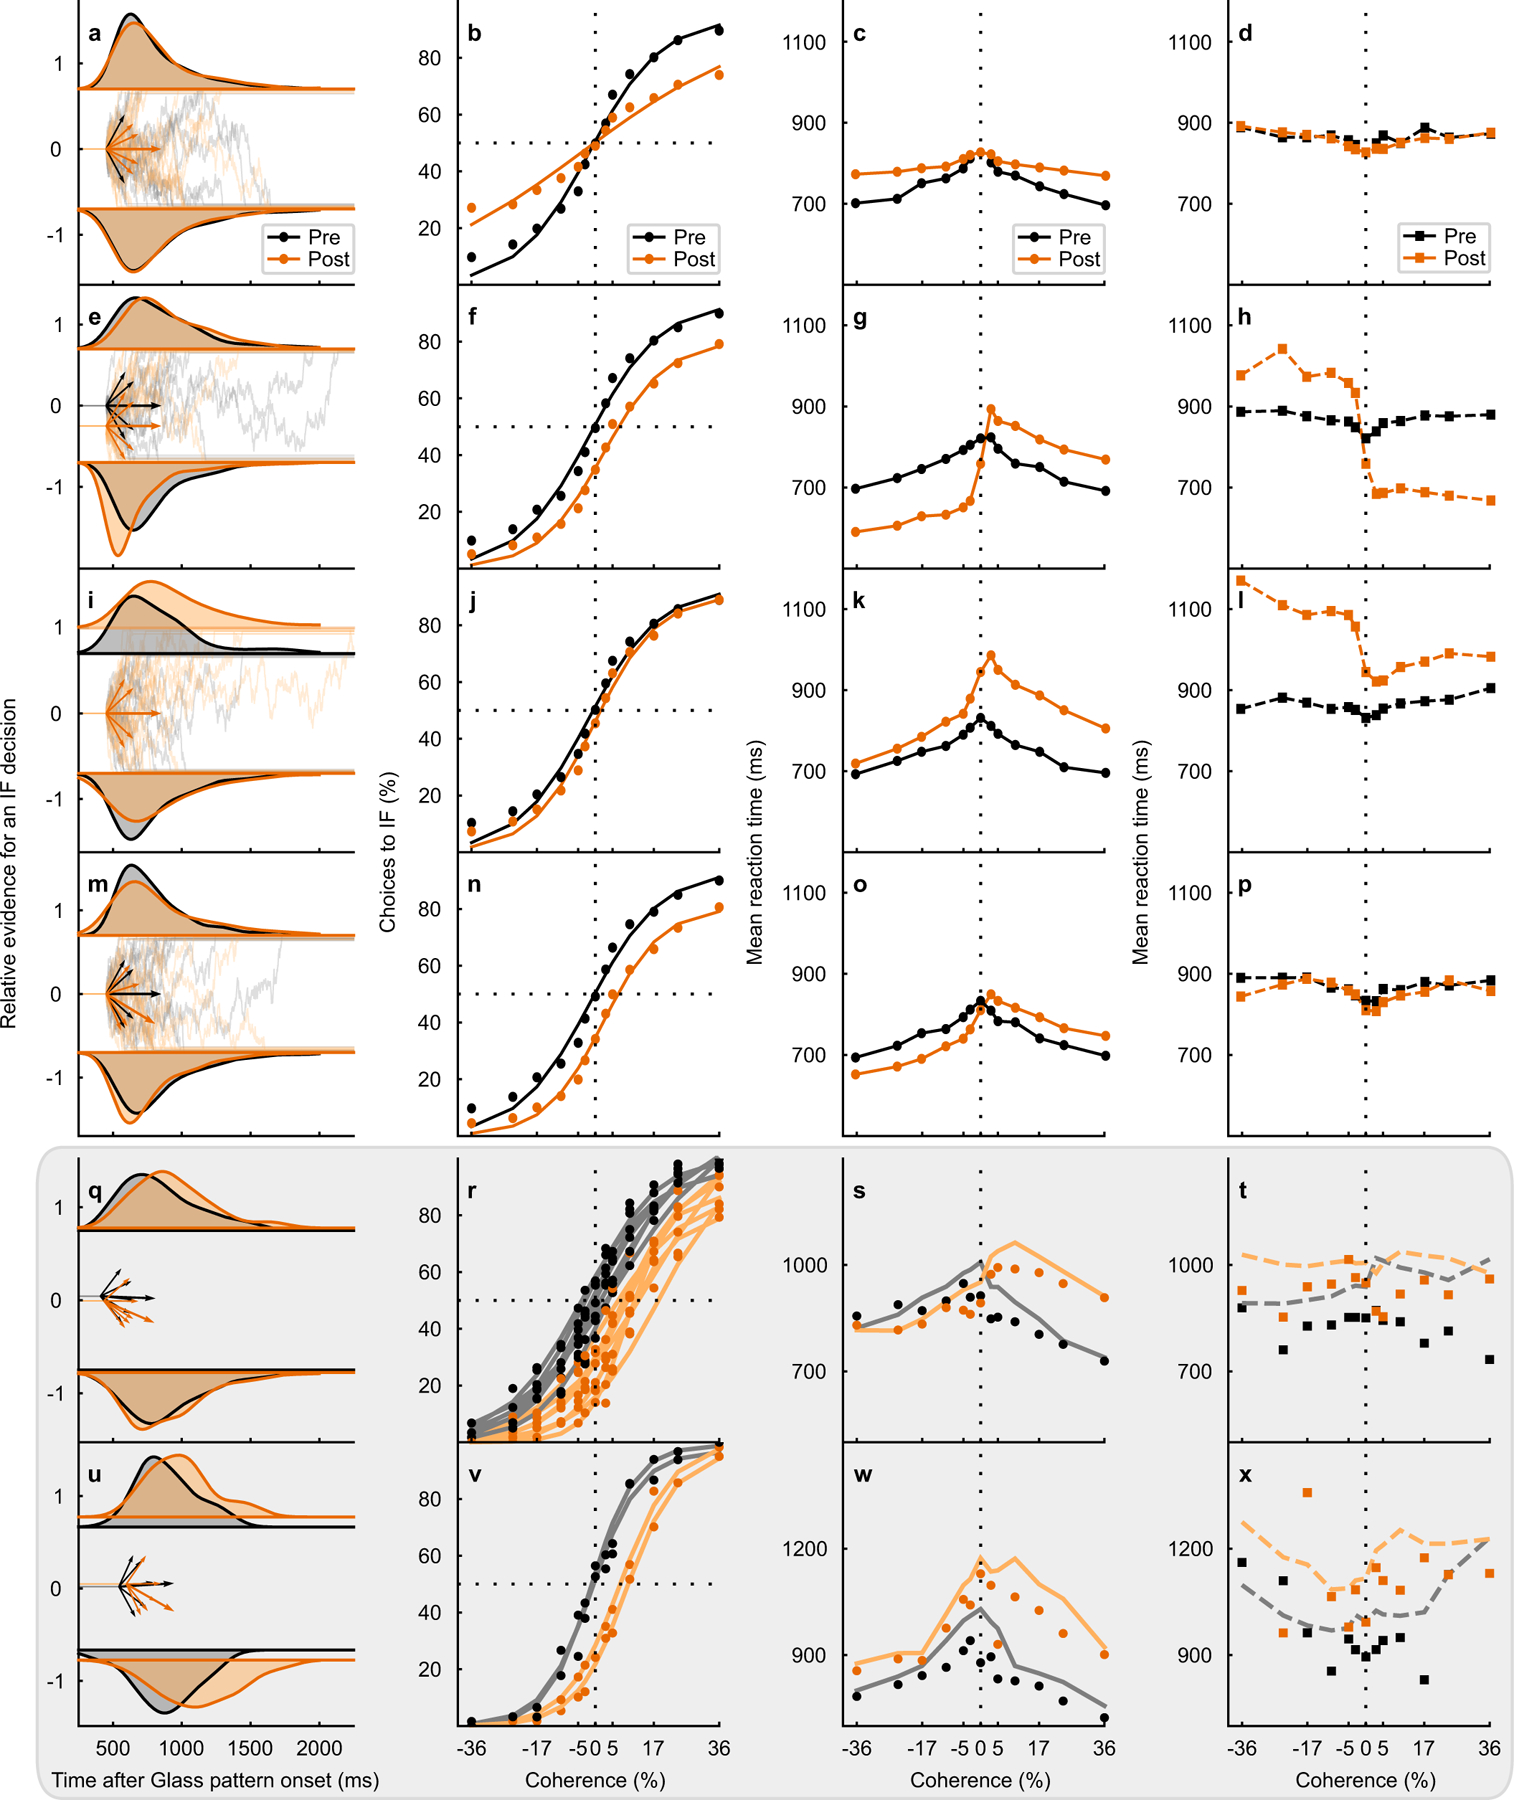
Fig. 5. Unilateral SC inactivation alters the drift rate offset.

a RT distributions (black = pre- and orange = post-muscimol, top = toIF RTs, and bottom = awayIF RTs) from the 0% coherence condition (density approximated through kernel smoothing) predicted by a DDM simulation with only a decrease in proportionality factor between coherence and drift rate. The relative evidence for toIF decisions is plotted over time from Glass pattern onset and the short arrows show drift rates for toIF decisions (positive) and awayIF decisions (negative) pre- and post-muscimol, for the 0%, 10%, and 36% coherence conditions. The longer arrow shows the drift rate offset. b The psychometric function, plotted as a proportion of toIF decisions over coherences, predicted by the model simulation with a decrease in proportionality factor between coherence and drift rate. c Mean RT predictions for correct trials for each coherence condition for the DDM variant with a decrease in proportionality factor between coherence and drift rate. d Same as in c but for error trials. e–h Same as in a-d but for the DDM variant with only a change in proportional starting point of the evidence accumulation away from the IF. i–l Same as in a-d but for the DDM variant with an increase in the upper boundary but no absolute start point change. m–p Same as in a-d but for the DDM with only a decrease in the drift rate offset parameter, implemented by shifting all the drift rates by the same amount away from the IF. q RT distributions from the 0% coherence condition of the actual data from monkey S, along with the fitted HDDM parameters of the drift rates and the drift rate offset below. r Psychometric function of the RT task sessions (n=7 sessions) in monkey S. The circles show the data and the lines show the HDDM fits to the data. The change in the drift rate offset is evident as a rightward lateral shift in the psychometric function post-muscimol (orange). s The mean RT for correct trials (circles) for all RT task data from monkey S are plotted against coherence along with their HDDM fits (lines). t Same as in s but for mean RT for error trials (squares) and their HDDM fits (lines). u–x Same as in q-t for monkey B showing all RT task data (n=2 sessions) and the HDDM fits. Note that the first four rows show simulations and the last two rows with gray shading show the data from the two monkeys. See Extended Data Fig. 5 for additional simulations and explanation.
