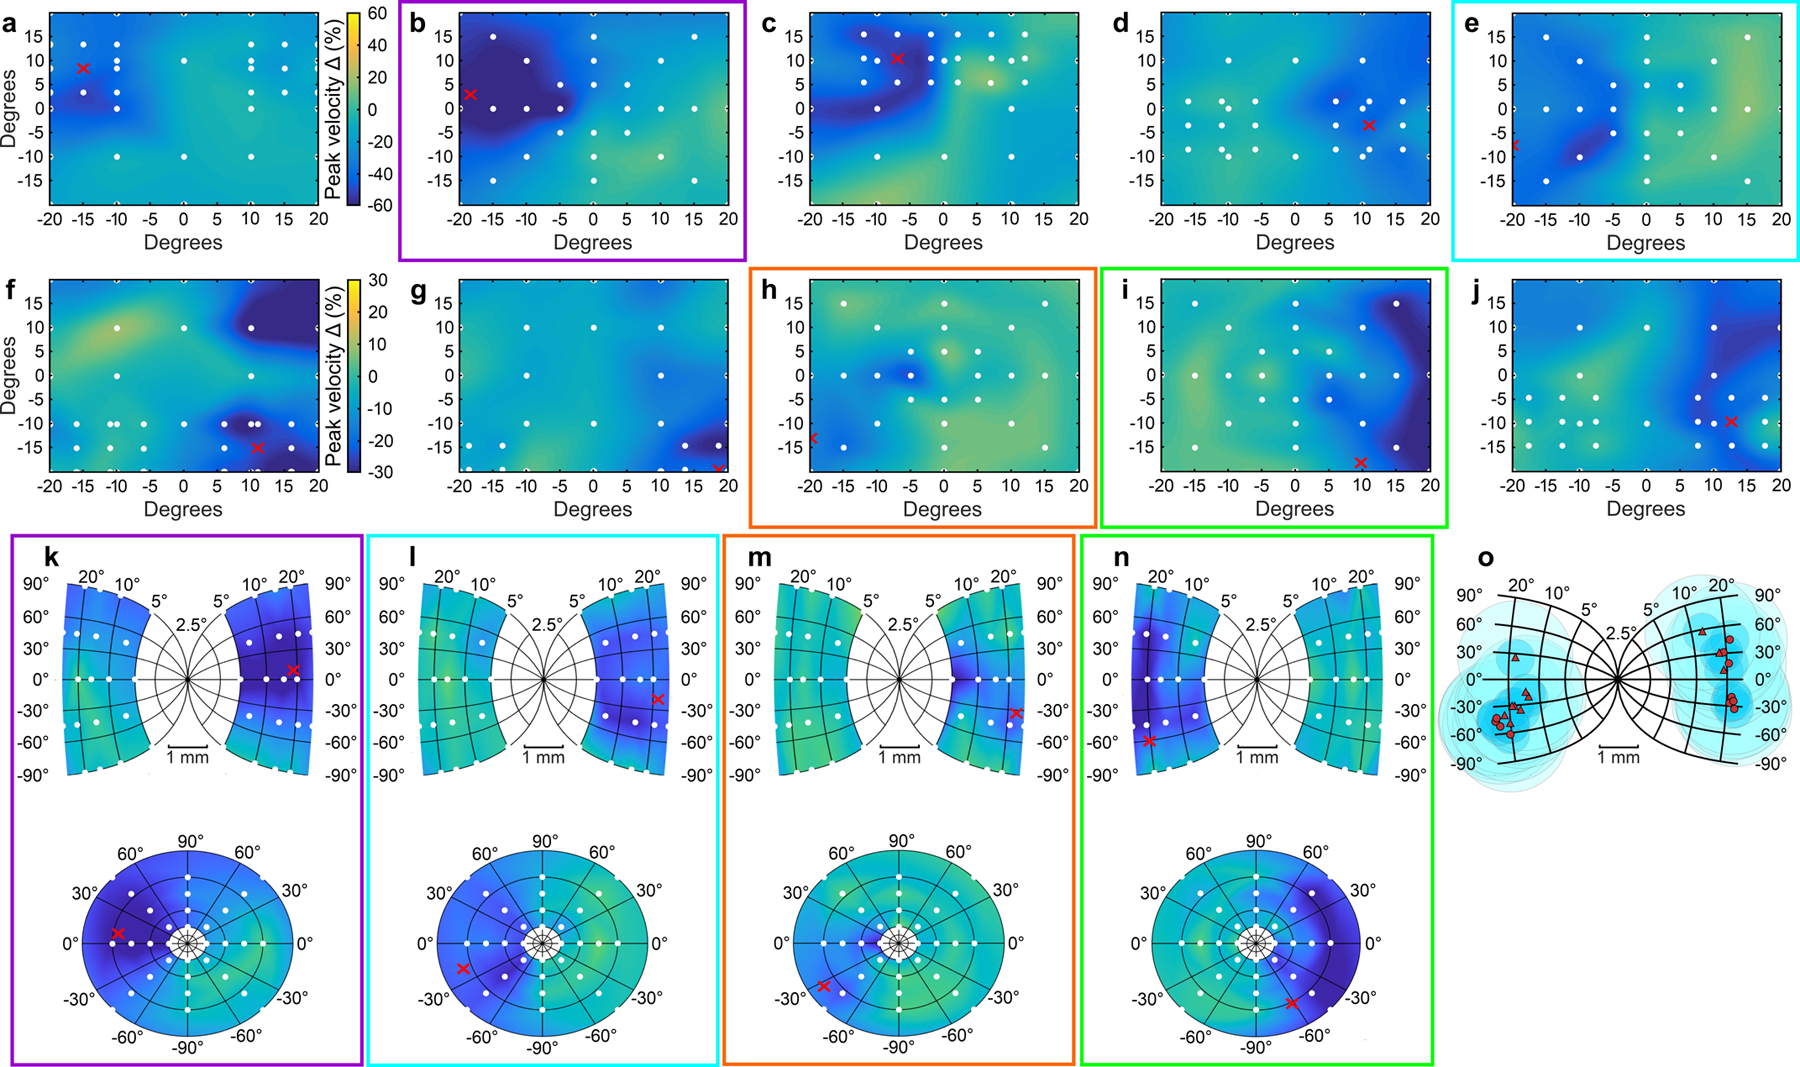
Extended Data Fig. 1. Estimates of muscimol spread in the SC.

(Associated with Fig. 1 main text) a–j The reduction in peak velocity from pre- to post-muscimol for 10 muscimol injections (four from monkey B, six from monkey S), one to two hours post injection. The percent change in peak velocity after muscimol injection (post-muscimol saccade velocity minus pre-muscimol saccade velocity divided by pre-muscimol saccade velocity multiplied by 100), is plotted for the target positions indicated by the white circles and linearly interpolated on the visual field in Cartesian coordinates. Cooler colors indicate slower saccadic velocities post-muscimol. a–e shows five injections with more concentrated effects of muscimol (color bar scaled from −60% to 60%), whereas f–j shows five injections with smaller but more diffuse effects of muscimol (color bar scaled from −30% to 30%), showing the range in the efficacy of our muscimol injections based on changes in saccade velocity at least one hour post injection. Red Xs show the site of injection based on the RF determined electrophysiologically (Supplementary Table 1). The peak velocity maps highlighted by the colored boxes in a–j had a uniform and homogenous sampling of positions in the visual field that allowed us to calculate the estimated spread across the SC map as shown in k–n (Quaia, C., Aizawa, H., Optican, L.M. & Wurtz, R.H. Reversible inactivation of monkey superior colliculus: II. Maps of saccadic deficits. Journal of Neurophysiology 79, 2097–2110 (1998).). k–n show the same percent change in peak velocity after muscimol injections plotted on the SC map (top) and the visual field in polar coordinates (bottom) for the injections in the corresponding colored boxes in a–j. o shows the locations of muscimol injections and spread estimates plotted onto the SC map. Red circles show injection locations for monkey B and red triangles show injections from monkey S. Each injection’s estimated muscimol spread is represented by two concentric circles. The darker shaded circles show 0.5 mm radius and the lighter shaded circles shows 1.5 mm radius from the center of the injection site based on estimates from (Allen, T.A., et al. Imaging the spread of reversible brain inactivations using fluorescent muscimol. Journal of Neuroscience Methods 171, 30–38 (2008).). There were three injections in which muscimol may have spread into the pretectal region and thus also the foveal region of the rostral SC, as evidenced by the occurrence of ocular nystagmus about an hour after the injection. In these cases, we aborted the experiment and omitted the data from analyses upon appearance of nystagmus. One example appears in b and k (maps highlighted by purple boxes). The Glass pattern decision and selection task data before the occurrence of nystagmus are included in the analysis in the main text. The effect on the psychometric function from this example was the largest that we observed (Fig. 2a, rightmost transparent orange psychometric function).
