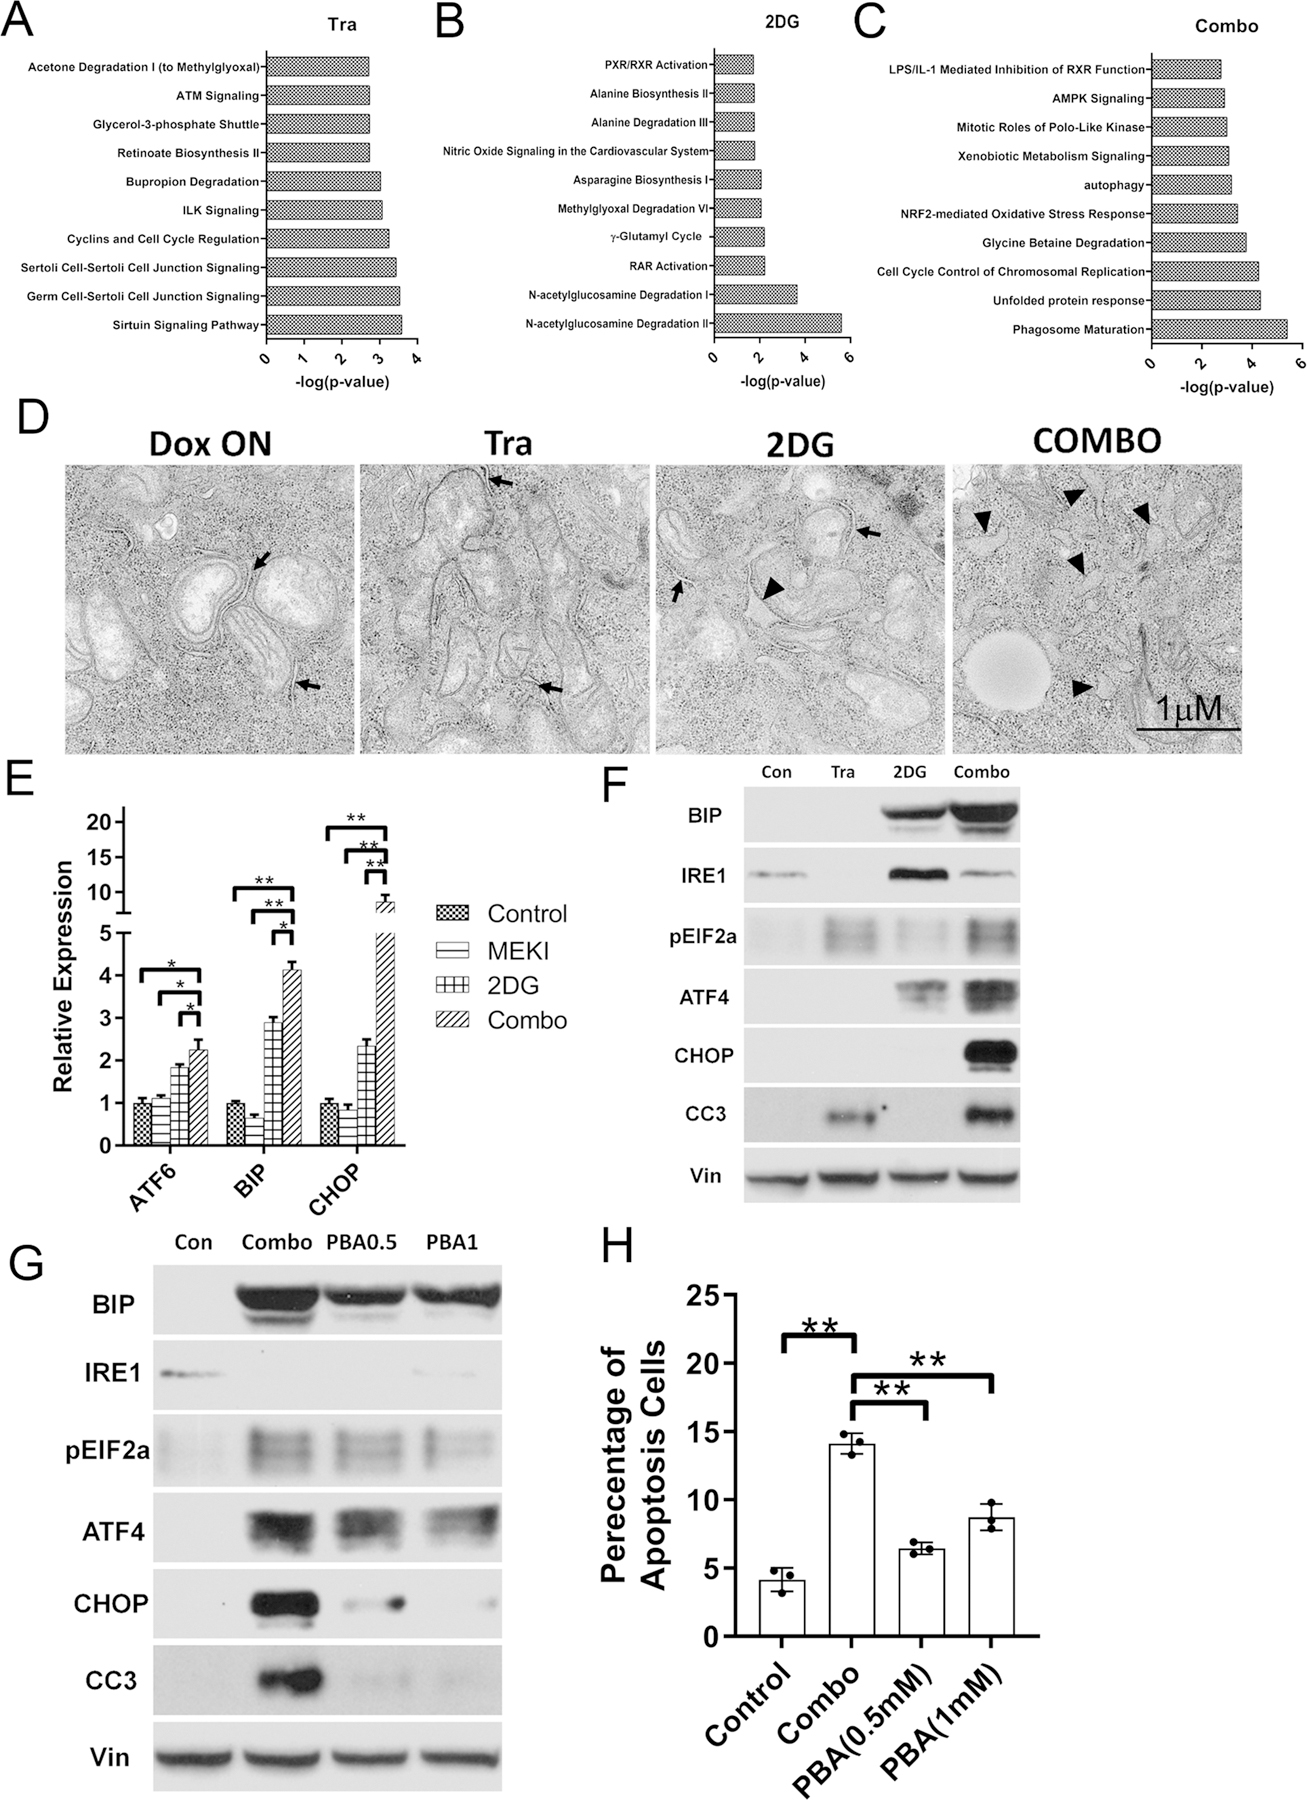
Figure 5. 2DG and Trametinib has a synergy to induce ER stress in PDAC cell lines.

(A-C) IPA analysis of differentially expressed genes in iKras lines treated with 2DG and Tra combination. (D) Representative TEM images of iKras cell treated with Tra, 2DG or Combination for 48h. The normal ER were indicated by arrow and swollen ER were indicates by arrowheads. (E-F) Expression of the ER stress markers in iKras treated with 25nM Tra, 1mM 2DG or combination for 48h detected by qPCR (E, n=3, Mean ± SD) or WB (F). (G) Expression of the ER stress markers in iKras treated with Tra/2DG or Tra/2DG/PBA by WB. (H) Apoptosis analysis of iKras cell treated with Tra/2DG or Tra/2DG/PBA by Annexin-V staining (n=3, Mean ± SD). Tra: 25nM; 2DG: 1mM and PBA: 0.5mM or 1mM.
