Figure 2.
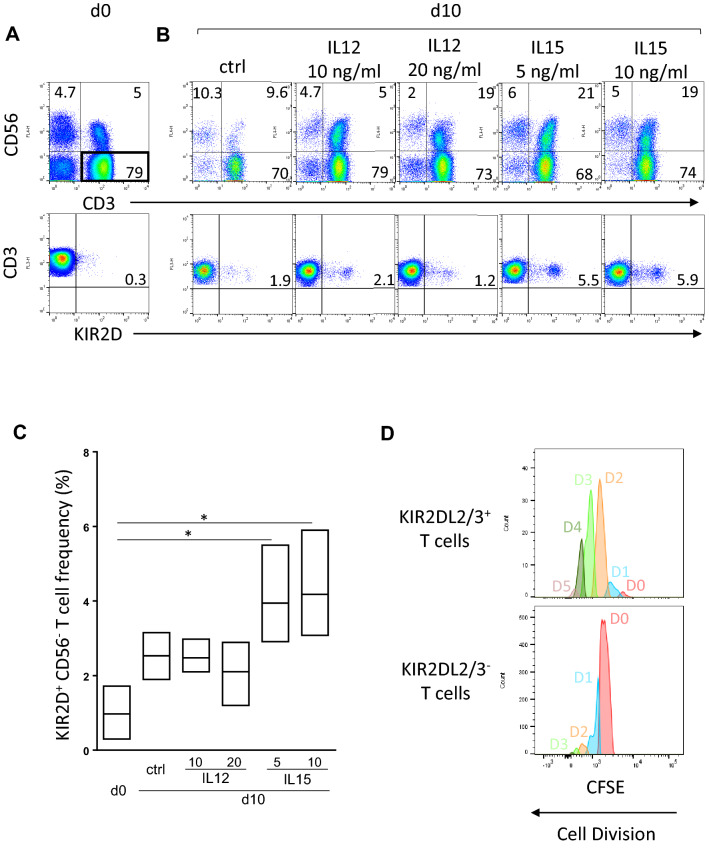
IL-15 stimulates KIR+ lymphocyte expansion. (A) Representative density plots illustrating KIR2DL1/2/3/2DS1/2 expression on CD56− T cell subsets targeted using CD3 and CD56 combination at day 0 by flow cytometry (B) and day 10 after PBMC culture with IL-2 at 50 U/ml alone or in combination with IL-12 (10 and 20 ng/ml) or IL-15 (5 and 10 ng/ml). The cell frequency is indicated on all density plots. (C) Floating bars (min to max) compiling results of different experiments realized from 3 healthy blood donors. *Indicates p < 0.05, ANOVA. (D) Representative histograms of KIR− and KIR+ T cell proliferation by the method of CFSE that allows the identification of dividing cells stimulated for 6 days with 10 ng/ml IL-15. Generation’s gates are indicated (DO to D5).

