Figure 6.
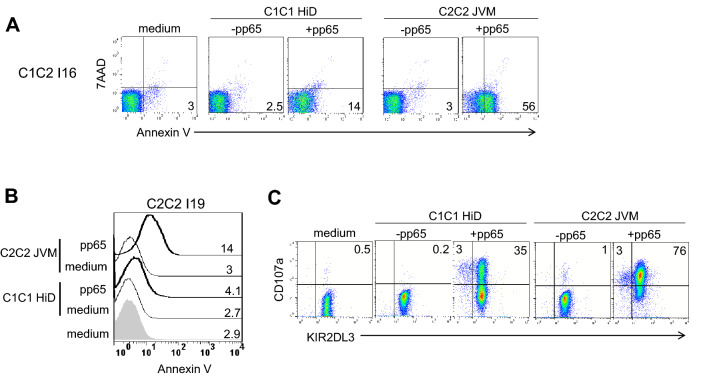
KIR2DL3 inhibits T lymphocyte apoptosis. (A) Density plots illustrating apoptotic HLA-A2-pp65 specific KIR2DL2/3+ T lymphocytes as annexin V+ 7AAD− after 3 h incubation alone or in presence of pp65 (0.1 µg/ml) loaded allogeneic C1C1 (ChT, HiD) and C2C2 (JVM, BM9) EBV-B cell lines for one representative C1C2 individual (I16) performed twice and for 2 C1C2 individuals. Mean Fluorescent Intensity (MFI) of Annexin V+ cells is indicated on all density plots. (B) Histograms representing annexin V expression by HLA-A2-pp65 specific KIR2DL3+ T lymphocytes after 3 h incubation alone or in presence of pp65 (0 and 0.1 µg/ml) loaded allogeneic C1C1 (ChT, HiD) and C2C2 (JVM, BM9) EBV-B cell lines for one C2C2 individual (I19). Mean Fluorescent Intensity (MFI) of Annexin V+ cells is indicated for all conditions. (C) Density plots illustrating HLA-A2-pp65 specific KIR2DL3+ T cell degranulation in the presence of pp65 (0 and 0.1 µg/ml) loaded allogeneic C1C1 (ChT, HiD) and C2C2 (JVM, BM9) EBV-B cell lines for one C2C2 individual (I19).

