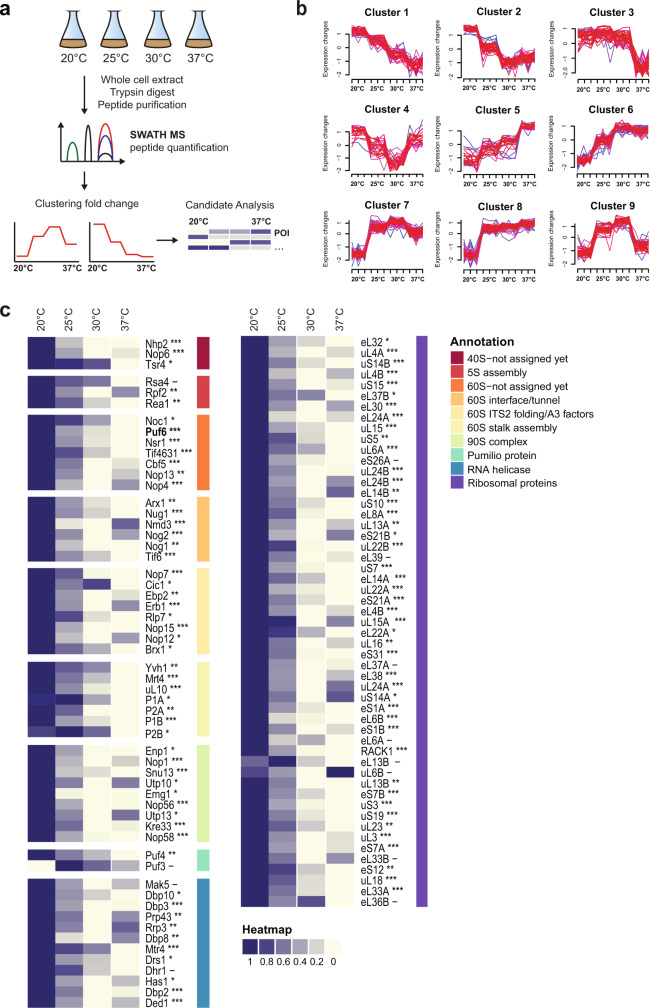
Fig. 1. Quantifying alterations in the proteome by SWATH-MS in yeast cells grown at different temperatures.
a Experimental workflow for SWATH-MS characterization of proteomes of yeast cells grown at 20, 25, 30, and 37 °C. Whole-cell extracts derived from WT yeast cells grown at indicated temperatures were subjected to the SWATH-MS and hierarchical clustering of proteins based on their abundance profile at different temperatures was performed. b Hierarchical clustering profiles of protein levels at the indicated temperatures. c Relative enrichment of ribosome assembly factors and ribosomal proteins from clusters 1, 2, and 4. Maximum enrichment is depicted in purple and minimum enrichment in gold. Proteins were further grouped based on their GO annotations—according to the indicated color code. Significance of the protein change was assessed using a one-way ANOVA test, with the resulting p-value further adjusted using the FDR method; ***adj.p.value < 0.0001; **adj.p.value < 0.001; *adj.p.value < 0.01; –adj.p.value ≥ 0.01.

