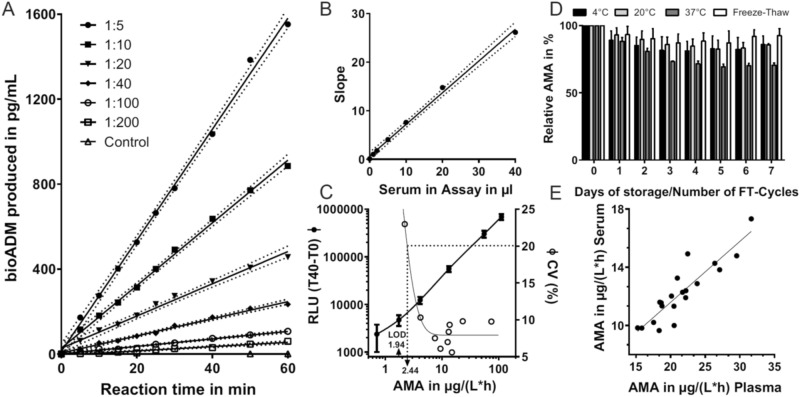
Figure 2.
AMA Assay characteristics and analyte stability. (A) Time-dependent product formation linearity with varying serum dilutions as source of human native PAM in assay. Product formation linearity of each dilution was verified with Runs Test. (B) Slopes from each serum dilution (A) were plotted against the volume of serum used in the assay. The 95% confidence interval is shown as dotted lines in (A) and (B). (C) Representative dose–response curve of enzymatic calibrator (bold line, closed circles) and interassay precision profile (empty circles) for the determination of PAM-AMA. Each point represents a mean of 16 measurements. (D) Stability analysis of native human PAM-AMA in serum as source of PAM. Activity of treated material was normalized to activity of untreated material that was set as 100%. (E) Spearman-correlation of PAM-AMA from matched serum and Li-heparin plasma samples (r = 0.89; p < 0.0001; n = 22).

