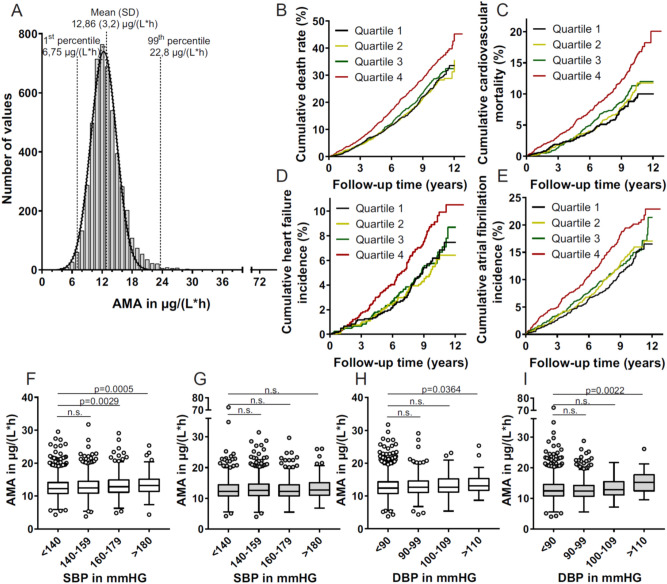
Figure 3.
PAM-AMA analysis in n = 4942 individuals from the population based MPP study cohort. (A) Frequency distribution of PAM-AMA. The data did not pass the D’Angostino–Pearson omnibus test for normal distribution; a normal distribution curve (solid line) was fitted into the frequency distribution of the cohort. The 95% CI is shown as dotted lines. Kaplan Meier analysis for all-cause mortality risk (B), cardiovascular mortality risk (C), heart failure risk (D) and atrial fibrillation risk (E) in relation to serum AMA levels. Subjects analyzed in (C) and (D) were free of heart failure or atrial fibrillation at baseline. Over the follow-up time of 12.8 years the cumulative rates of each indication differed between the highest quartile of AMA (Q4) and the lowest Quartile of AMA (Q1). Quantitative analyses are summarized in Table 4 (B,C) and Table 5 (D,E). PAM-AMA in subjects from the MPP-cohort was categorized according to systolic- (F,G) and diastolic blood pressure (H,I). The population was divided in subject not receiving antihypertensive treatment (F,H) and in subjects receiving antihypertensive treatment (G,I). Difference in PAM-AMA was analyzed via one-way ANOVA (Dunn’s correction). Significance of differences is shown in each panel, n.s. not significant.

