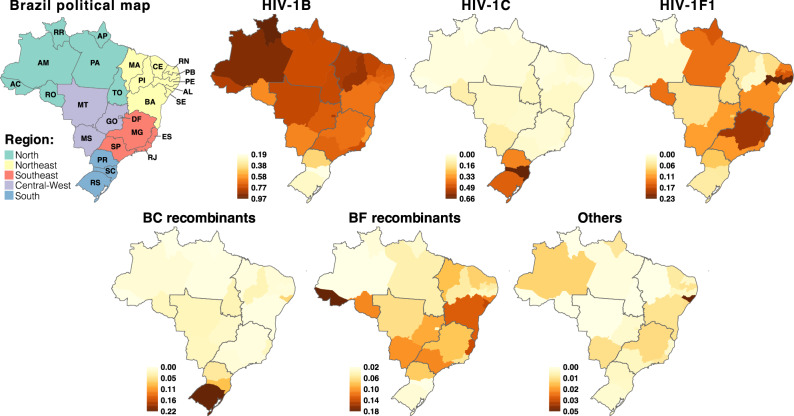
Figure 2.
Frequency of HIV-1 subtypes and main recombinant forms in Brazil. Brazilian states are colored according to variant frequency among all sampled sequences in the last triennium of the dataset (2015–2017). The color scale is unique for each viral variant and political division is showed for country regions as in the map on the left. Maps were draw in R (version 4.0.3—https://www.r-project.org) using the libraries tmap, sf and brazilmaps. AL Alagoas, AP Amapá, AM Amazonas, BA Bahia, CE Ceará, DF Distrito Federal, ES Espírito Santo, GO Goiás, MA Maranhão, MT Mato Grosso, MS Mato Grosso do Sul, MG Minas Gerais, PA Pará, PB Paraíba, PR Paraná, PE Pernambuco, PI Piauí, RJ Rio de Janeiro, RN Rio Grande do Norte, RS Rio Grande do Sul, RO Rondônia, RR Roraima, SC Santa Catarina, SP São Paulo, SE Sergipe, TO Tocantins.

