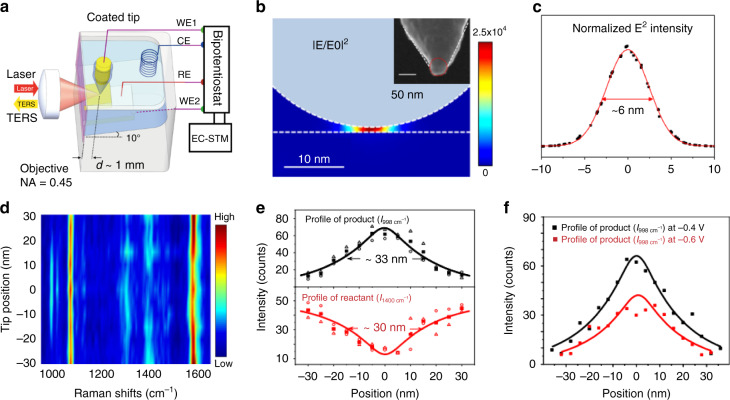
Fig. 12. Macro-optics for EC-TERS.
a Schematic illustration of the EC-TERS105. b Calculated plasmonic electric field (E2) distribution when the Ag tip is positioned on the Au surface. Inset: scanning electron microscope image of the Ag tip. c Calculated E2 profile on the substrate surface in the plasmonic gap. Red line is fitted using a Gaussian function. d Color-coded intensity map of the line-trace TERS spectra across a reaction region. The reaction was induced at the sample potential of −0.4 V under a laser power of 0.7 mW. The line-trace TERS spectra were acquired with the sample potential at −0.7 V. Bias: 100 mV, Itunneling: 800 pA. e Plots of intensities of the 998 cm−1 peak (top) and 1400 cm−1 peak (bottom) with the tip position. The open triangle, circle symbols represent the intensities in the trace and retrace spectra. The solid square symbols represent the average intensities of the trace and retrace spectra. f Profile of the reaction induced at −0.6 and −0.4 V for comparison106

