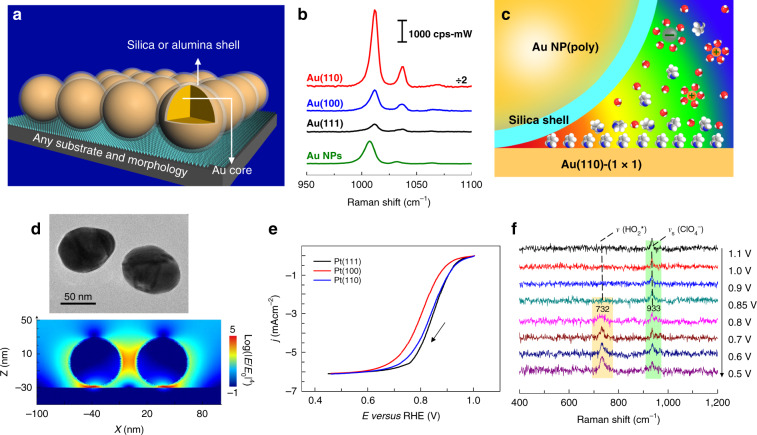
Fig. 7. SHINERS for surface detection.
a SHINERS on a substrate31. b SHINERS spectra of pyridine adsorbed on Au(111), Au(100), and Au(110) at 0.00 V. Solution: 10 mM pyridine + 0.1 M NaClO4. SERS spectra of pyridine on bare 55 nm gold NPs at different potentials. c Schematic diagrams of the SHINERS experiments. The EM field strength is represented by the following color code: red (strong) and blue (weak).67 d TEM and simulated images. 3D-FDTD simulations of four SHINs with a model of a 2 × 2 array on a Pt substrate. E and E0 represent the localized electric field and the incident electric field, respectively. e Polarization curves of the ORR process at three Pt(hkl) RDEs in oxygen-saturated 0.1 M HClO4 solutions; the rotation rate was 1600 r.p.m. and the scan rate was 50 mV s−1. j and E represent the current density and potential, respectively. f EC-SHINERS spectra of the ORR system at a Pt(111) electrode surface in a 0.1 M HClO4 solution saturated with O274

