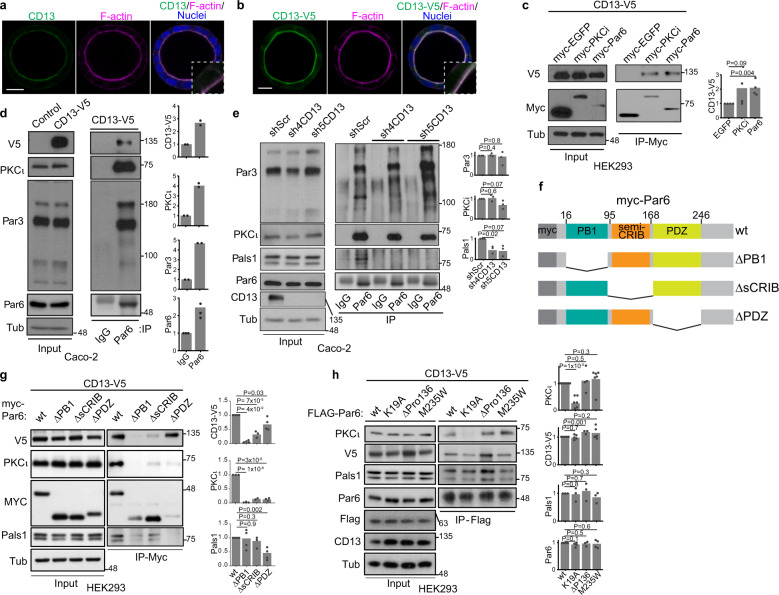
Fig. 1. CD13 localizes at the apical domain of 3D Caco-2 cysts and associates with PB1 domain of Par6.
a, b Confocal images of polarized Caco2 cysts following 10 days in culture and immunostained for endogenous CD13 (a, green) or V5-tagged CD13 (b, green) and F-actin (phalloidin, magenta). Images are representative from three independent experiments. c Co-immunoprecipitation of CD13 and EGFP, PKCι, or Par6 was performed with anti-myc in HEK293 cells. The presence of CD13 in immunoprecipitates was determined by western blot analysis using anti-V5. Graphs to the right show quantification of band intensities from n = 4 independent experiments. d Immunoprecipitation was performed with IgG or anti-Par6 in stably expressed CD13-V5 Caco-2 cells and blotted for V5, PKCι, Par3, and Par6. Graphs to the right show quantification of band intensities from n = 2 independent experiments. e Immunoprecipitation was performed with anti-Par6 antibody or IgG control from shScr, sh4-CD13 and sh5-CD13 knock-down Caco-2 cell lysates and blotted for Par3, PKCι, Pals1, Par6, and CD13. Graphs to the right show quantification of band intensities from n=3 independent experiments. f Schematic diagram showing Par6 domains and deletion mutants. g Co-immunoprecipitation of CD13 and wild-type (wt) or Par6 deletion mutants was performed with anti-myc in HEK293 cells. Graphs to the right show quantification of band intensities from n = 4 independent experiments. h Co-immunoprecipitation of CD13 and wild-type (wt), or Flag-tagged Par6 containing point mutations (K19A, ΔP136, M235W) performed with anti-Flag antibodies in HEK293 cells. Graphs to the right show quantification of band intensities from independent experiments (PKCι, n = 6; CD13-V5, n = 5; Pals1, n = 3; Par6, n = 4). p-values were calculated by ANOVA with Tukey’s posthoc test for multiple comparisons (c, e, g, h). Bars: a and b, 10 μm.

