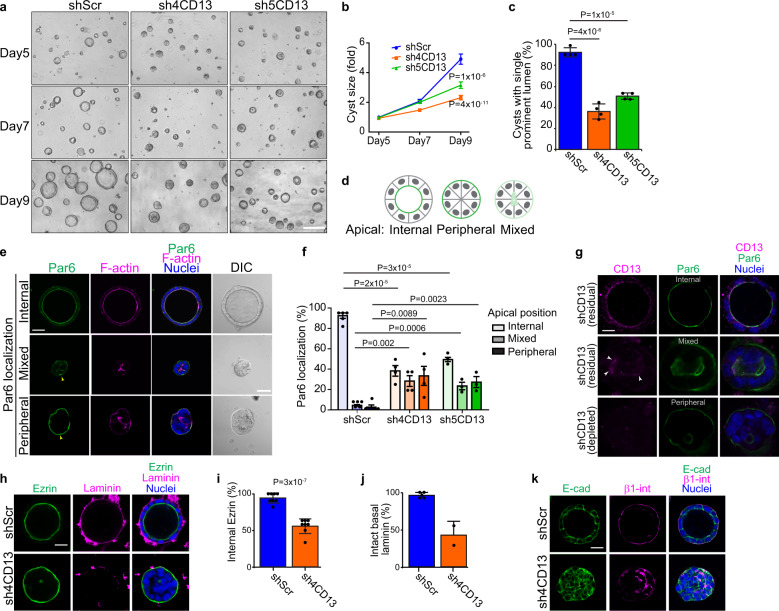
Fig. 2. CD13 knockdown disrupts the orientation of apical-basal polarity.
a Phase contrast images showing the phenotype of shScr, sh4- and sh5-CD13 knock-down in 3D Caco-2 cysts after 5, 7, and 9 days in culture. b Quantification of the size of 3D Caco-2 structures for the indicated conditions after 5, 7, and 9 days in culture. Data are reported as mean ± SEM for the indicated conditions (n = 129 shScr, n = 126 sh4-CD13, and n = 160 sh5-CD13 cysts) from a single representative experiment. Comparisons of multiple means were performed by ANOVA using Tukey’s post-hoc test on data from day 9. c Quantification of cysts with single prominent lumen of shScr (n = 806), sh4-CD13 (n = 961) and sh5-CD13 (n = 1312) knock-down in 3D Caco-2 cysts on day 10. Individual dots represent mean values from each of 4 independent experiments. d The schematic diagram showing different phenotypes (internal, peripheral, mixed) of apical Par6 observed. e Confocal images of Par6 (green) and F-actin (magenta) showing different Par6 localization (internal, peripheral, mixed) in 3D Caco-2 cysts. Yellow arrow heads indicate peripheral Par6 localization. f Quantification of Par6 localization (internal, peripheral, mixed) in Caco-2 structures for the indicated conditions (n = 358 shScr, n = 336 sh4-CD13, and n = 187 sh5-CD13 cysts) after 10 days in culture. Dots represent the mean from each of 4 independent experiments. g Confocal images of shCD13-expressing Caco-2 cells immunostained for endogenous CD13 (magenta) and Par6 (green) to visualize residual/depleted CD13 in individual cysts with different phenotypes. h Confocal images CD13 knock-down Caco-2 cysts immunostained for Ezrin (green) and laminin (magenta) showing cells with inverted apical-basal polarity. i Quantification of internal Ezrin in shScr (n = 168) and sh4CD13 (n = 150) 3D Caco-2 cysts after 10 days in culture. Dots represent means from each of 8 independent experiments. j Quantification of intact basal laminin in shScr (n = 71) and sh4CD13 (n = 35) Caco-2 cysts after 10 days in culture. Dots represent means from each of two independent experiments. k Images for E-cad (green) and β1-integrin (magenta) showing cell polarity are disrupted in CD13 knock-down 3D Caco-2 cysts. Data are represented as mean ± SEM (b, f) or mean ± SD (c, i, j). p-values were calculated by ANOVA with Tukey’s posthoc test for multiple comparisons (b, c, f) or unpaired two-tailed student’s t-test (i). Images are representative of two (k) three (a), or four (e, g, h) independent experiments. Bars: a, 200 μm; e, 50 μm; g, 20 μm; h and k, 30 μm.

