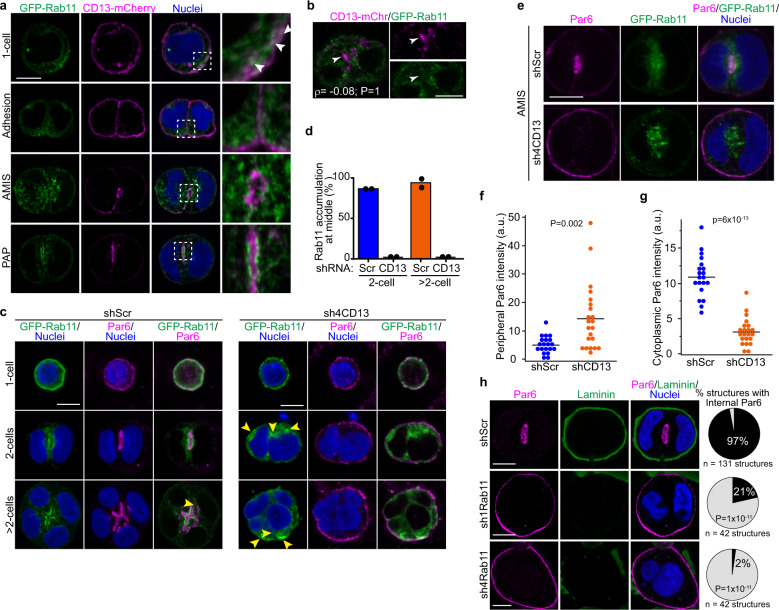
Fig. 5. CD13 Knockdown disrupts Rab11-dependent early polarization in Caco-2 cells.
a Confocal images showing the localization of CD13-mCherry (magenta) and GFP-Rab11 (green) at 1-cell, and adhesion, AMIS, and PAP stage in 2-cell 3D Caco-2 structures. White arrows show the proximity of CD13 puncta with Rab11-positive vesicles near the plasma membrane. b Confocal images of Caco-2 cells showing CD13-mCh (magenta) and GFP-Rab11 (green) vesicles during AMIS formation. Object-based colocalization was performed for CD13 and Rab11, and produced a correlation efficient ρ = -0.08. Arrows show local sites of CD13 accumulation. c Confocal images of GFP-Rab11 (green) and Par6 (magenta) showing their localization in shScr and shCD13 Caco-2 cells. Yellow arrows show regions of concentrated Rab11-positive vesicles. d Quantification of the percentage of Rab11 accumulation at the middle of shScr (n = 92) and shCD13 (n = 24) at 2 cell and >2 cell 3D Caco-2 structures. Dots represent means from each of two independent experiments. e Confocal images of 3D Caco-2 structures at the AMIS stage showing localization of GFP-Rab11 (green) and Par6 (magenta). f, g Quantification of Par6 localization to the periphery (f) or cytoplasm (g) in shScr (n = 20) and shCD13 (n = 22) Caco-2 cells at the AMIS stage. Dots represent individual Caco-2 structures from a single experiment. h Confocal images of control (shScr) and Rab-down (sh1-Rab11, sh4-Rab11) 3D Caco-2 cells immunostained for Par6 (magenta) and laminin (green). Right – quantification of structures with internal Par6 staining as a measure of normal or inverted polarity. The indicated number of structures were measured from (n = 11 shScr, n = 11 sh1Rab11, and n = 9 sh4Rab11) experiments. p-values were determined by ANOVA with Tukey’s posthoc test for multiple comparisons (d, h) or unpaired two-tailed student’s t-test (f, g). Images are representative from two (c) or three (a,b, e, h) independent experiments. Bars: 10 μm.

