Figure 2.
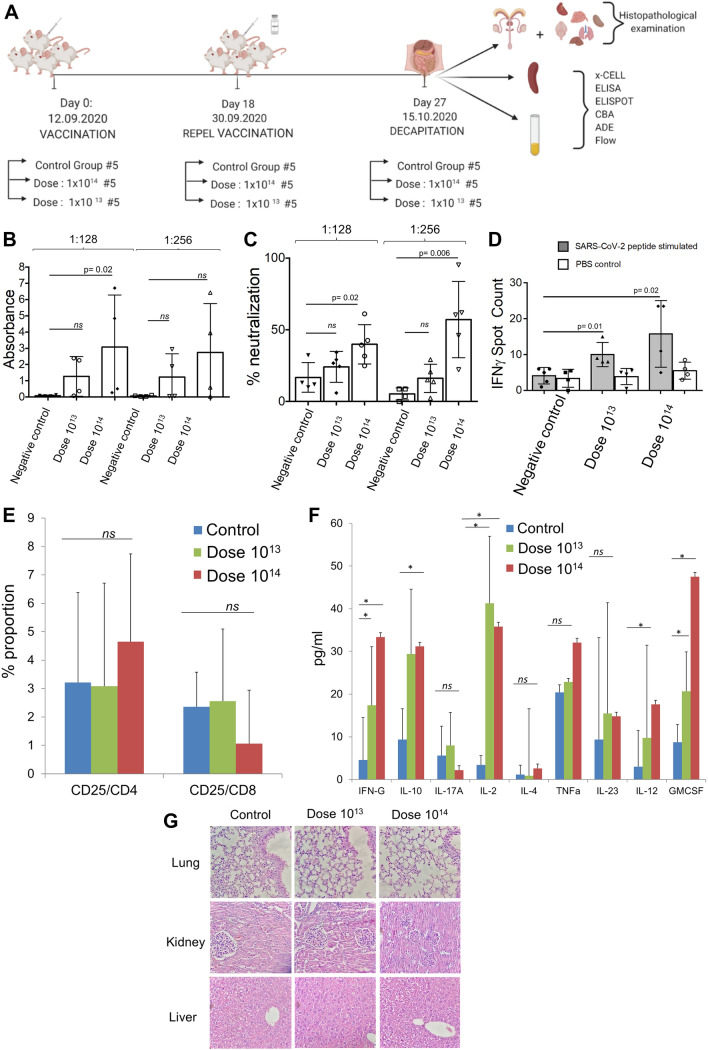
In vivo efficacy analysis of dose 1013 and dose 1014 in vaccinated BALB/c mice. (A) Representation of in vivo experimental setup of the BALB/c mice vaccinated with dose 1013 or dose 1014 of OZG-38.61.3. (B) The bar graph showing the presence (absorbance) of SARS-CoV-2 specific IgG in the mice sera diluted with either 1:128 or 1:256 detected using ELISA. (C) The bar graph showing the neutralization frequency of the mice sera diluted to 1:128 or 1:256 that were pre-incubated with a 100 × TCID50 dose of infective SARS-CoV-2. The analysis was performed with MTT analysis at 96 h. (D) The bar graph showing activation frequency (IFNγ positive spot count) of spleen T cells that were incubated with SARS-CoV-2 specific peptides. (E) The bar graph showing the proportion of the activated T cells after the stimulation. The activation was determined with the upregulation of the CD25 surface marker. (F) The bar graph showing cytokine proportions of spleen T cells that were incubated with SARS-CoV-2 specific peptides. (G) Histopathologic analysis of the lung, kidney, and liver tissues of BALB/c mice groups. H&E stain X400.

