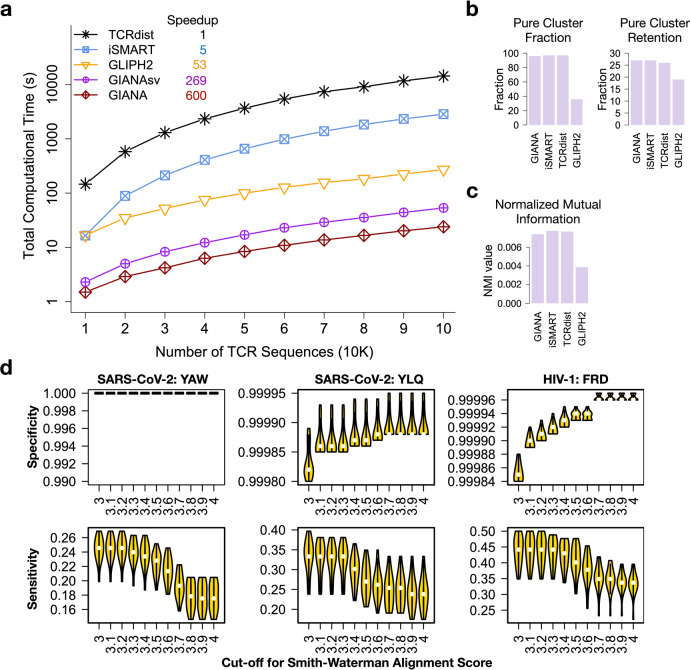
Fig. 2. Performance evaluation and comparison of different methods.
a Comparison of time complexity for five competing TCR clustering algorithms. Speedup was calculated based on the time cost for the 100 K TCR sample. b Comparison of purity cluster fraction and retention of four methods. y-axis shows the precision or sensitivity in percentage. c Normalized mutual information comparison of the four methods. d Sensitivity and Specificity of GIANA when applied to large and noisy TCR-seq samples. x-axis is the cutoff for Smith–Waterman alignment score, a key parameter in GIANA, with maximum 4.0. Higher cutoff results in higher specificity at the cost of reduced sensitivity.

