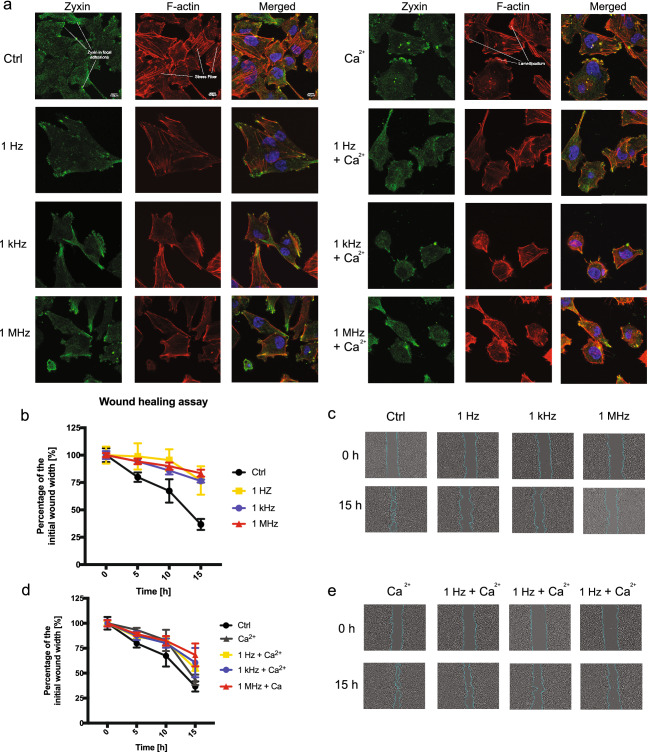
Figure 5.
PCa cells morphology and mobility after exposure to 25, 10 kV/cm, 200 ns pulses in different frequencies with and without extracellular Ca2+. (a) The representative photographs of cells exposed to bursts of nsPEFs. Confocal laser scanning microscopy visualize the rearrangement of zyxin (green fluorescent dye), F-actin (red fluorescent dye) nucleus (blue florescent dye) structure in DU 145 cells. (b, c) The percentage of a healed wound as a function of time. Images were analyzed by ImageJ software (Version: 2.1.0/1.53C; https://imagej.net/Fiji)28. (d, e) Images of wound gradually invaded by migrating cells. Images were taken in a given time interval. The graph represents the data from the three replicates of an individual experiment. Data are mean ± SD (n = 3 replicates).

