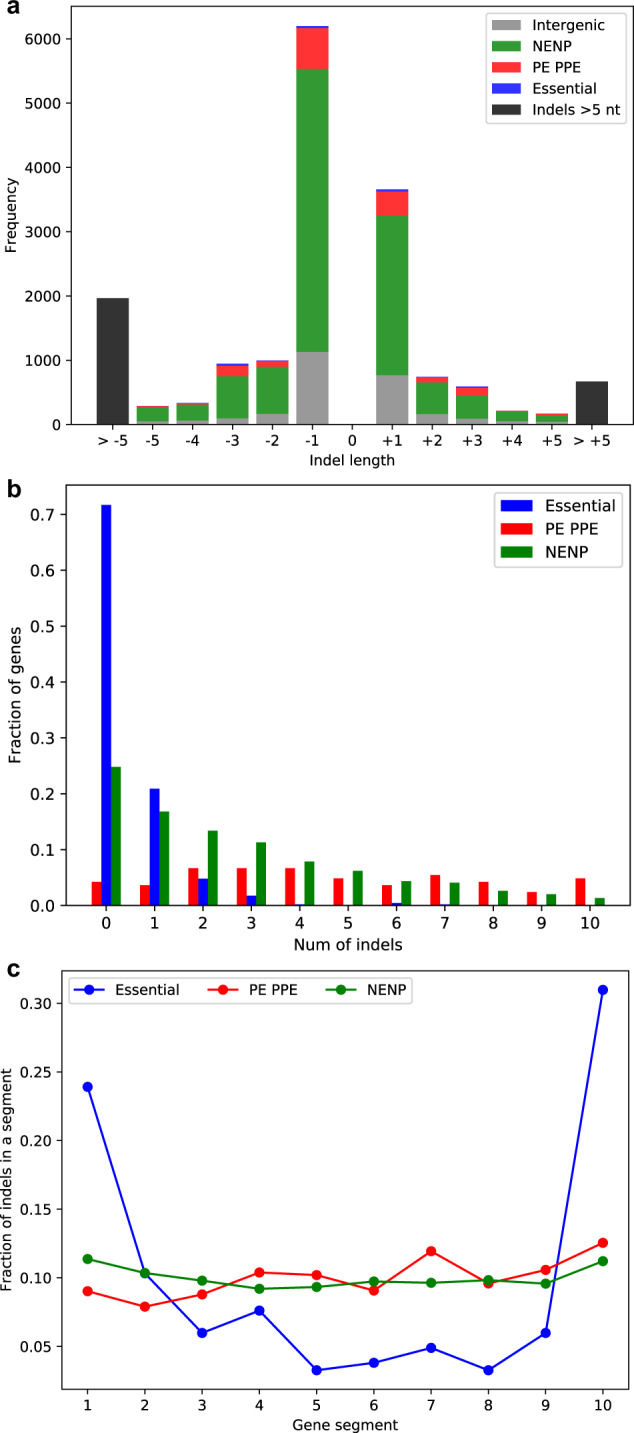
Fig. 1. Properties of unique insertions and deletions (indels) identified in 5977 clinical isolates of M. tuberculosis.

a Indel frequency (y-axis) is shown as a function of indel size (x-axis) for indels found in the intergenic regions (gray), nonessential non-PE-PPE genes (NENP, green), PE-PPE genes (red), and essential genes (blue). Positive indel sizes (x-axis) denote insertions and negative indel sizes denote deletions. The majority of indels are one nucleotide long and larger indels are less frequent (indels >5 nt are shown in black, see Table S10 for size distribution of >5 nt long indels). b Occurrence of unique indels (x-axis) is shown for essential (blue), PE-PPE (red), and the remaining non-essential non-PE-PPE (NENP, green) genes (data in Table S2). Approximately 70% of the essential genes have no indels whereas the highly repetitive PE-PPE genes have an almost uniform distribution of the number of unique indels that are found in these genes. c Fraction of unique indels in essential, PE-PPE, or NENP genes (y-axis) are shown along the gene length represented as gene-segments (x-axis). Each gene was divided into ten equal segments. The majority of indels in essential genes were found in the first and the last gene segments, unlike the PE-PPE and the remaining genes where indels were uniformly distributed throughout the gene.
