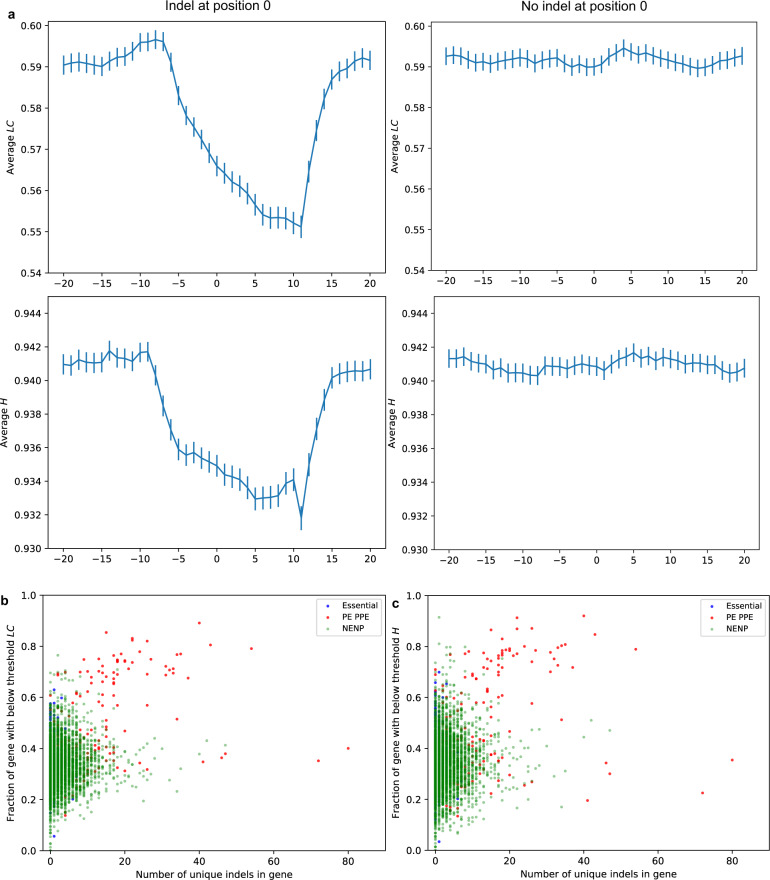
Fig. 2. Relationship between the frequency of indel occurrence and sequence complexity in the M. tuberculosis genome.
a The linguistic complexity (LC) and Shannon’s entropy (H) scores are shown for 20 positions upstream and downstream of orphan indels that do not have another indel within 100 bases (n = 5172), and randomly sampled non-indel sites that do not have an indel within 100 bases of the site (n = 5775). The sequence complexity profile in the vicinity of the indel and non-indel sites are different. The average LC and H scores adjacent to the indel sites show a decrease in the complexity scores 7–10 bases before the indel position (indicated by 0 on the x-axis) and 15–18 bases after the indel position. The error bars represent ±1 SEM (standard error of the mean). See Fig. S3 for density distributions of LC and H scores at and around these indel and non-indel positions. b The fraction of each gene that has a complexity score below the threshold score for LC, and c the fraction of each gene that has a complexity score below the threshold score for H in essential (blue), PE-PPE (red), and the remaining genes that are neither essential nor PE-PPE (NENP, faded green). The threshold scores (H = 0.932, LC = 0.551) are the lowest H/LC scores in the indel pockets shown in Fig. 2a.

