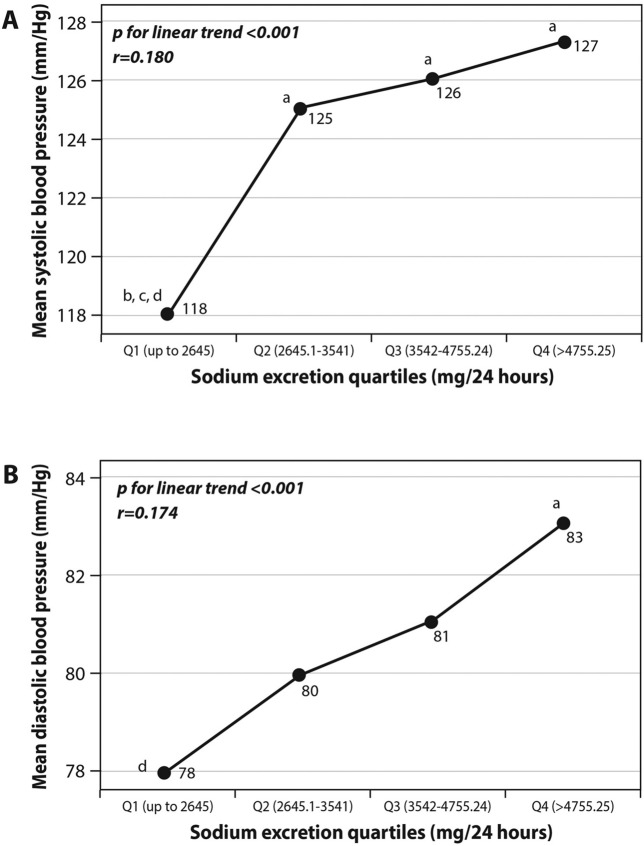
Figure 2.
(A,B) univariate associations between sodium excretion quartiles and systolic (A) or diastolic (B) blood pressure. Statistical differences between sodium excretion levels (analyzed using One-Way Analysis of variance [ANOVA]) are represented by the following letters: a = significantly different than Q1 (p < 0.05); b = significantly different than Q2 (p < 0.05); c = significantly different than Q3 (p < 0.05); d = significantly different than Q4 (p < 0.05).

