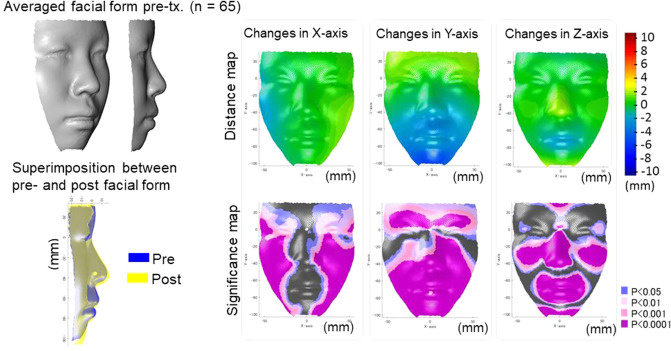
Figure 3.
The average actual facial changes in the Extraction group for pre-treatment (top-left) and the superimposition of the actual facial changes between pre-treatment (blue) and post-treatment (yellow). For the significance probability maps, significant changes between pre-treatment and post-treatment are indicated as follows: blue, P < 0.05; pale pink, P < 0.01; dark pink, P < 0.001; purple, P < 0.0001. For the distance maps, yellow indicates that the treatment changes from pre-treatment to post- treatment (post-treatment minus pre-treatment is a positive value, whereas blue indicates that the change is a negative value. Thus, in the horizontal direction in the Extraction group, yellow in the left-half face indicates lateral displacement and blue in the right-half face also indicates lateral displacement after treatment. In the vertical direction, blue indicates downward displacement after treatment in the Extraction group and yellow indicates upward displacement after treatment. In the anteroposterior direction, yellow indicates a protrusive movement, whereas blue indicates a retrusive movement after treatment. The figures were created using a custom MATLAB software (MATLAB 2020a, The Math Works, Natick, MA, USA).

