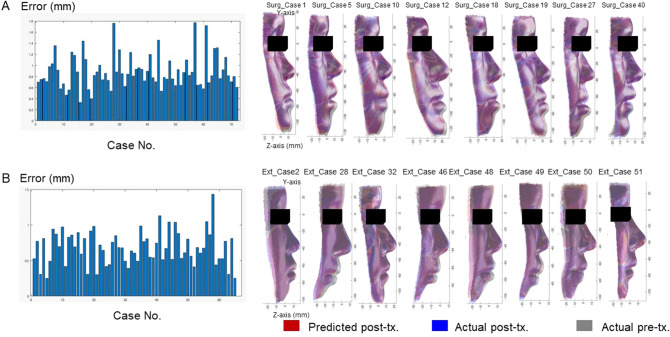
Figure 5.
Average error for each patient with Systems S (A) and E (B). In the left column, the x-axis indicates the case number and the y-axis indicates the prediction error, which was defined as the difference between the predicted and actual post-treatment surface values. The right column shows the predicted face (red), actual post-treatment face (blue), and actual pre-treatment face (grey) for the eight representative cases in each group.

