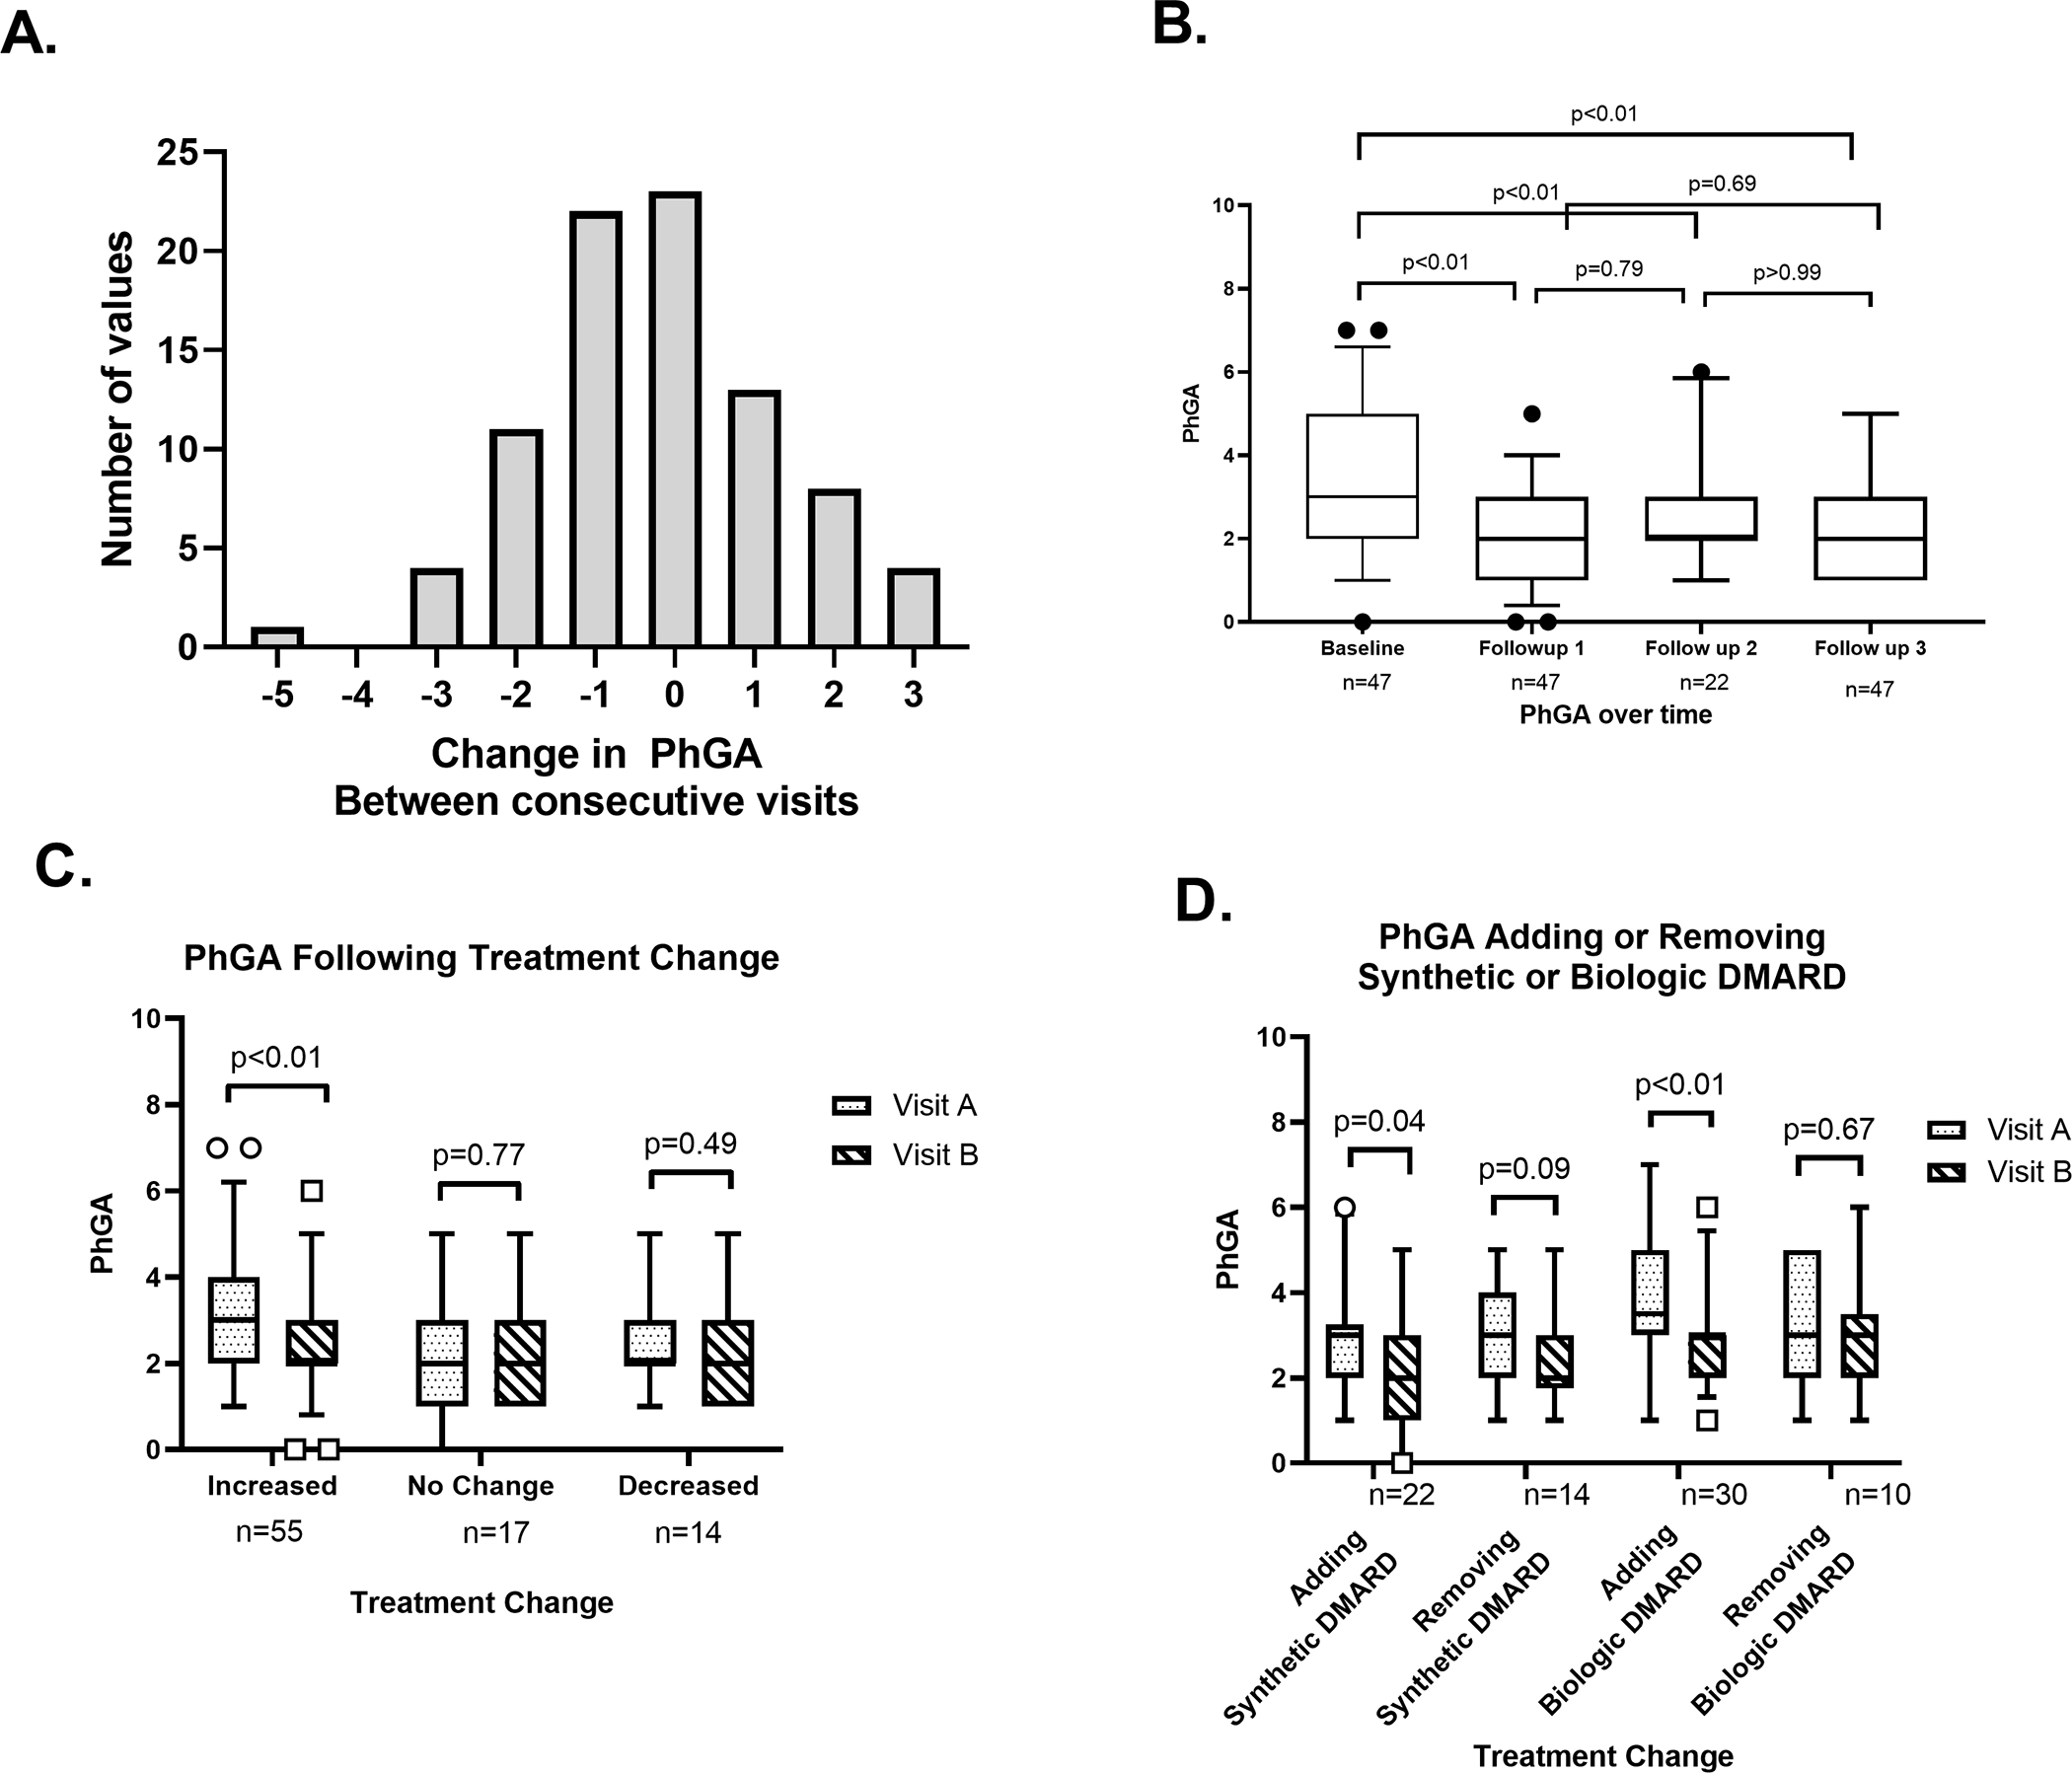
Figure 3. Interval change in physician global assessment (PhGA) score in association with treatment.

Histogram shows change in PhGA scores between consecutive visits over 86 visit intervals (A). Box and whisker plots of PhGA scores from four consecutive study visits in 47 patients with at least two study visits. The median (interquartile range) for the first 4 visits were: 3 (2–5), 2 (1–3), 2 (2–3) and 2 (1–3), respectively (B). Box and whisker plots of PhGA scores from two consecutive study visits categorized by an increase in treatment, no change in treatment, or a decrease in treatment between visits (C). Box and whisker plots of PhGA scores from consecutive study visits in relationship to specific treatment changes between visits (D).
