Fig. 1.

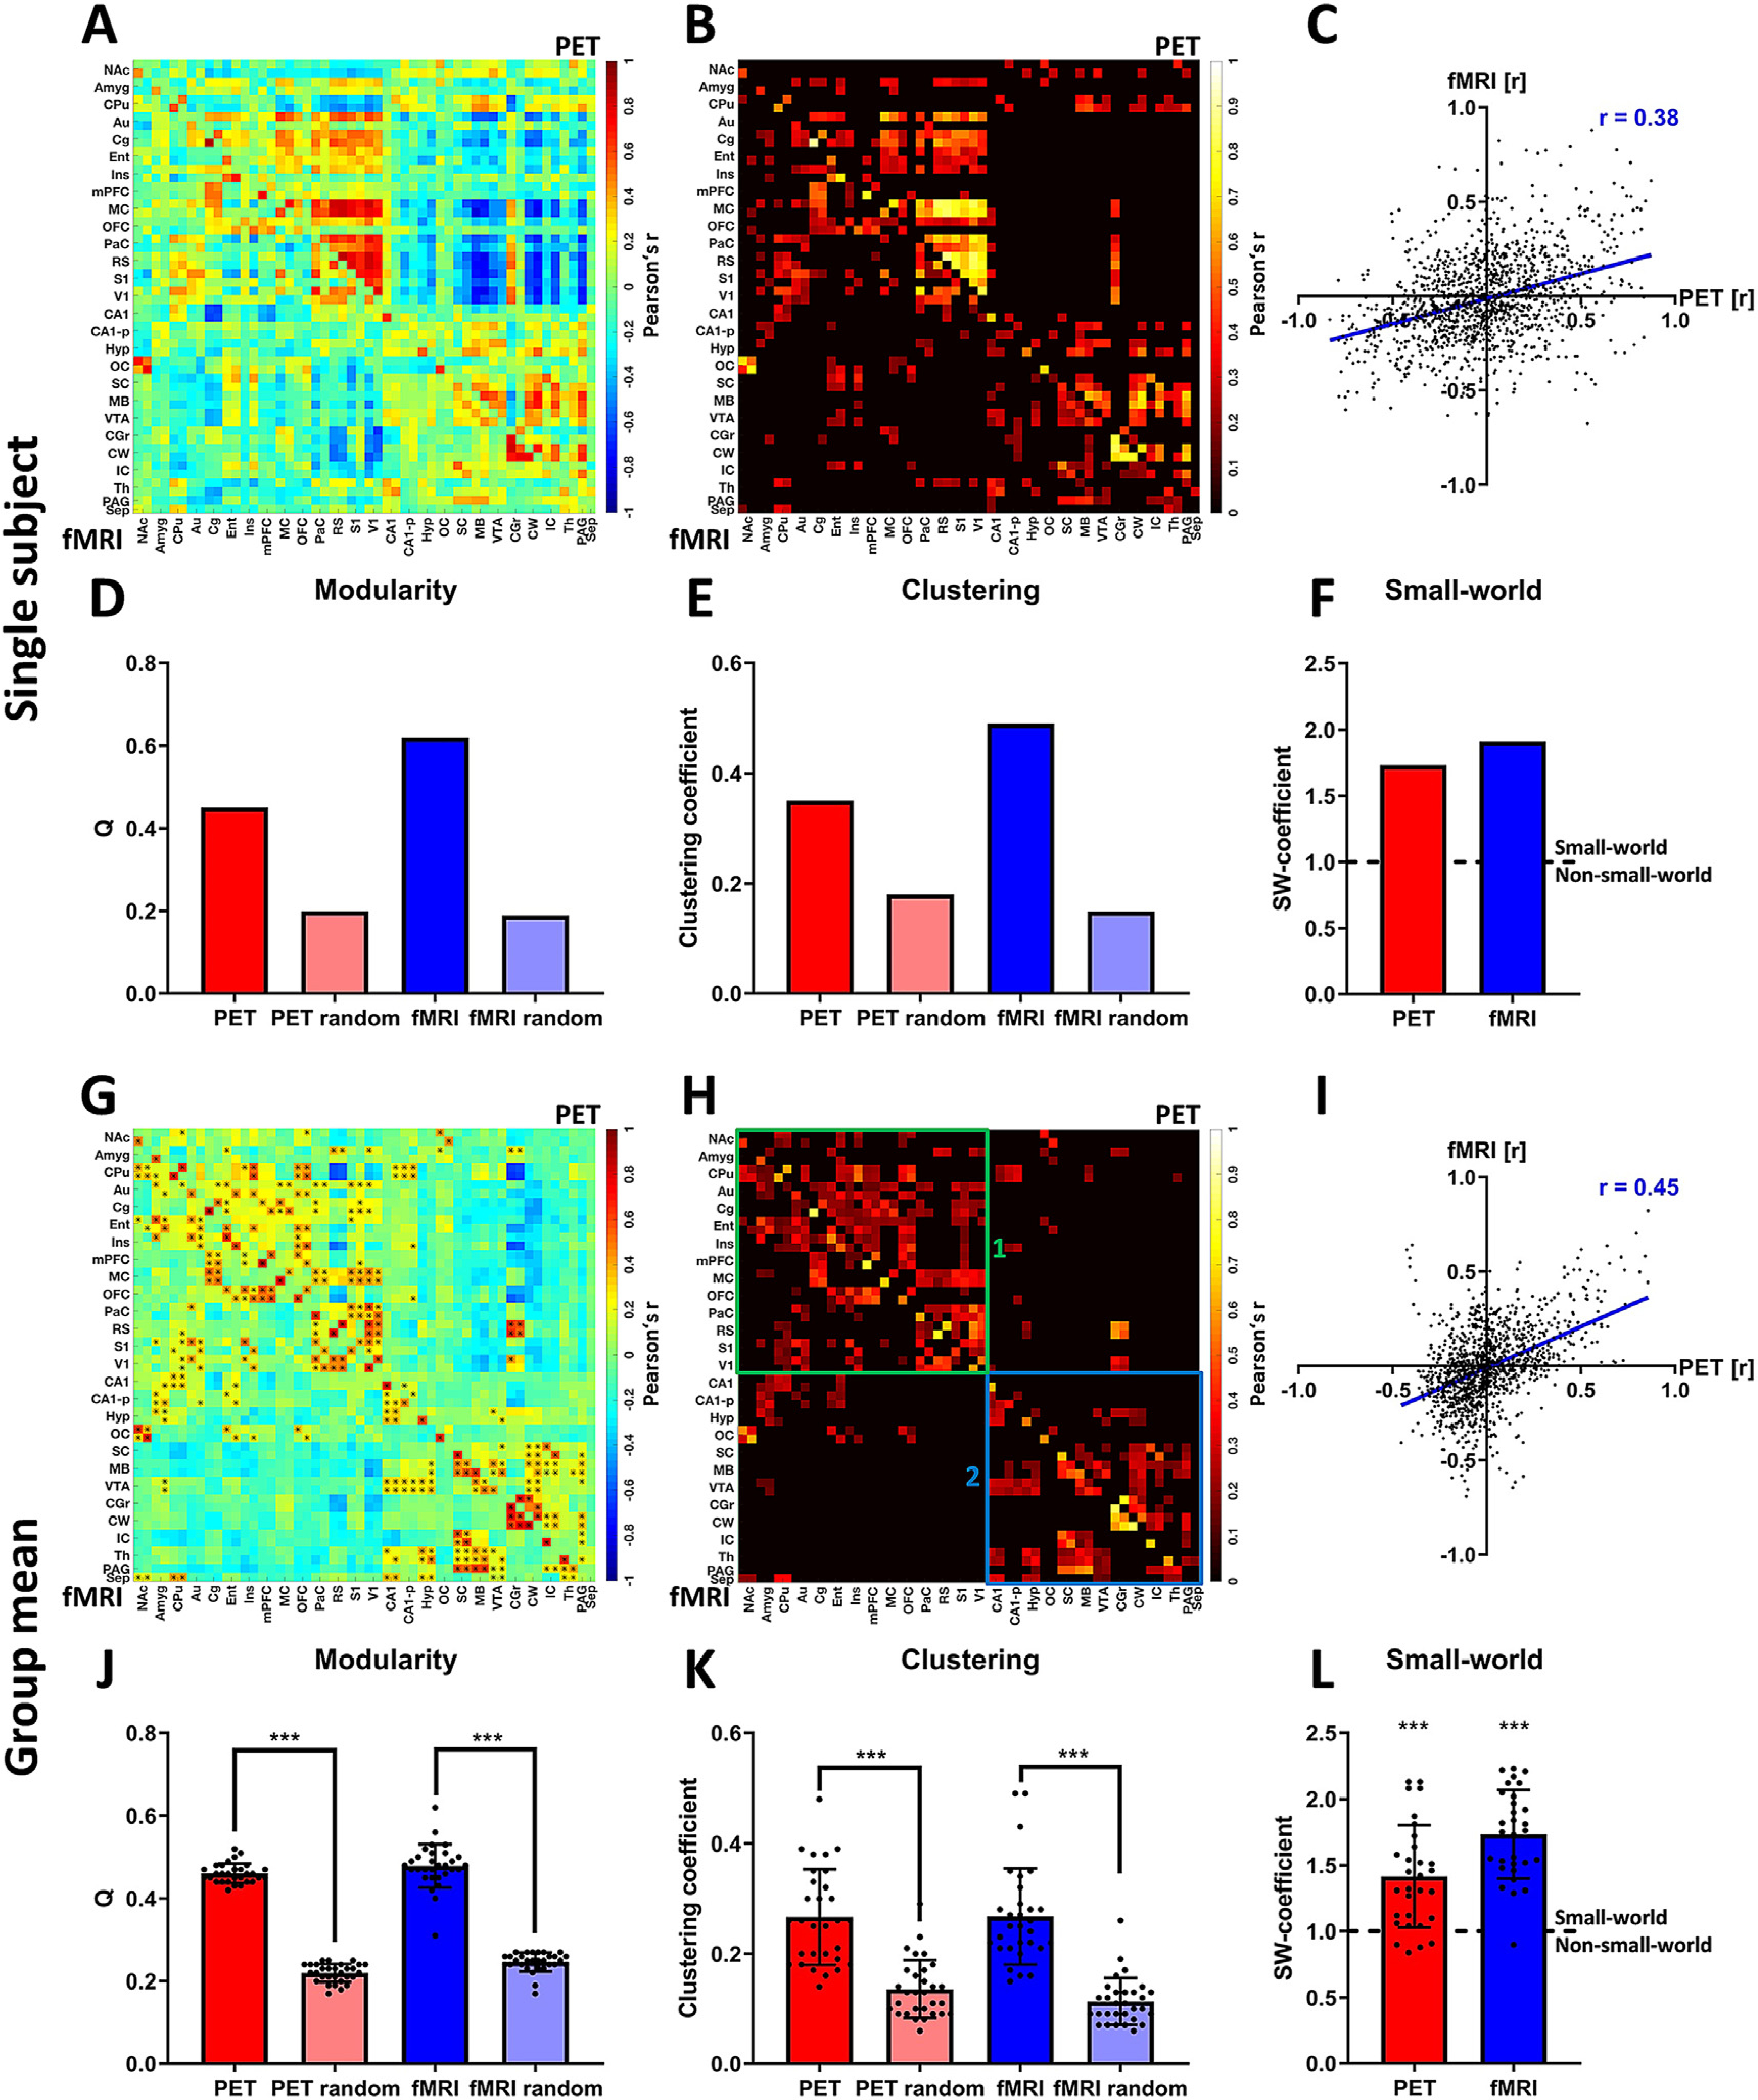
Assessment of whole-brain [18F]FDG correlations and FC. Panels (A)-(F) depict an exemplary analysis at the single-subject level: (A) PET/fMRI correlation matrix indicating [18F]FDG-PET-derived correlations (upper half of the matrix above the diagonal) and fMRI-derived FC (lower half of the matrix below the diagonal). (B) Thresholded PET/fMRI correlation matrix (20% sparsity) indicating similar areas of [18F]FDG connectivity and BOLD FC. (C) Scatter plot of all [18F]FDG correlations and FC values to assess the correlation of both outputs on the whole-brain level. (D) Ideal modularities of [18F]FDG connectivity and FC compared to the ideal modularity of respective randomized networks with the same average degrees. (E) Clustering coefficients of [18F]FDG correlation matrices and FC compared to the clustering coefficients of respective randomized matrices with the same average degrees. (F) Small-world coefficients of [18F]FDG connectivity and FC. The dotted line indicates the threshold (SW ≥ 1) for which networks are considered to have small-world properties. Panels (G)-(L) depict the analysis at the group-mean level: (G) Mean correlation matrix revealing similar patterns between [18F]FDG correlations (above diagonal) and FC (below diagonal). ∗ indicate significant correlations (p ≤ 0.05, corrected for multiple comparisons using Bonferroni-Holm). (H) Mean positive correlation matrix thresholded to a sparsity of 20% to define similar clusters between [18F]FDG correlations and FC. (1) Cluster indicating common [18F]FDG connectivity and FC in the cortex and in the anterior subcortical regions. (2) Cluster indicating common subcortical, midbrain and cerebellar [18F]FDG connectivity and FC. (I) Scatter plot of [18F]FDG connectivity and FC along with Pearson’s r coefficient to assess the correlation of both outputs. (J) Mean ideal modularity of [18F]FDG correlations and FC of every subject compared to respective randomized networks with the same average degree (paired-t-tests). (K) Mean clustering coefficients of [18F]FDG connectivity and FC of every subject compared to the respective randomized networks with the same average degree (paired-t-tests). (L) Small-world coefficients of [18F]FDG connectivity and FC of every subject showing small-world properties for the majority of subjects for both outputs. Both group means were significantly higher than 1 (p ≤ 0.001, one-sample t-tests). (*** represents a confidence interval of p ≤ 0.001; dotted line in (L) indicates threshold for which networks are considered to have a small-world organization (SW-coefficient ≥ 1) or not to exhibit such organization (SW-coefficient < 1), while *** represents a confidence of p ≤ 0.001 for the respective dataset being significantly higher than 1). FC = fMRI-derived functional connectivity, SW = small-world. For a list of abbreviations of all regions, please refer to Supplementary Table 1.
