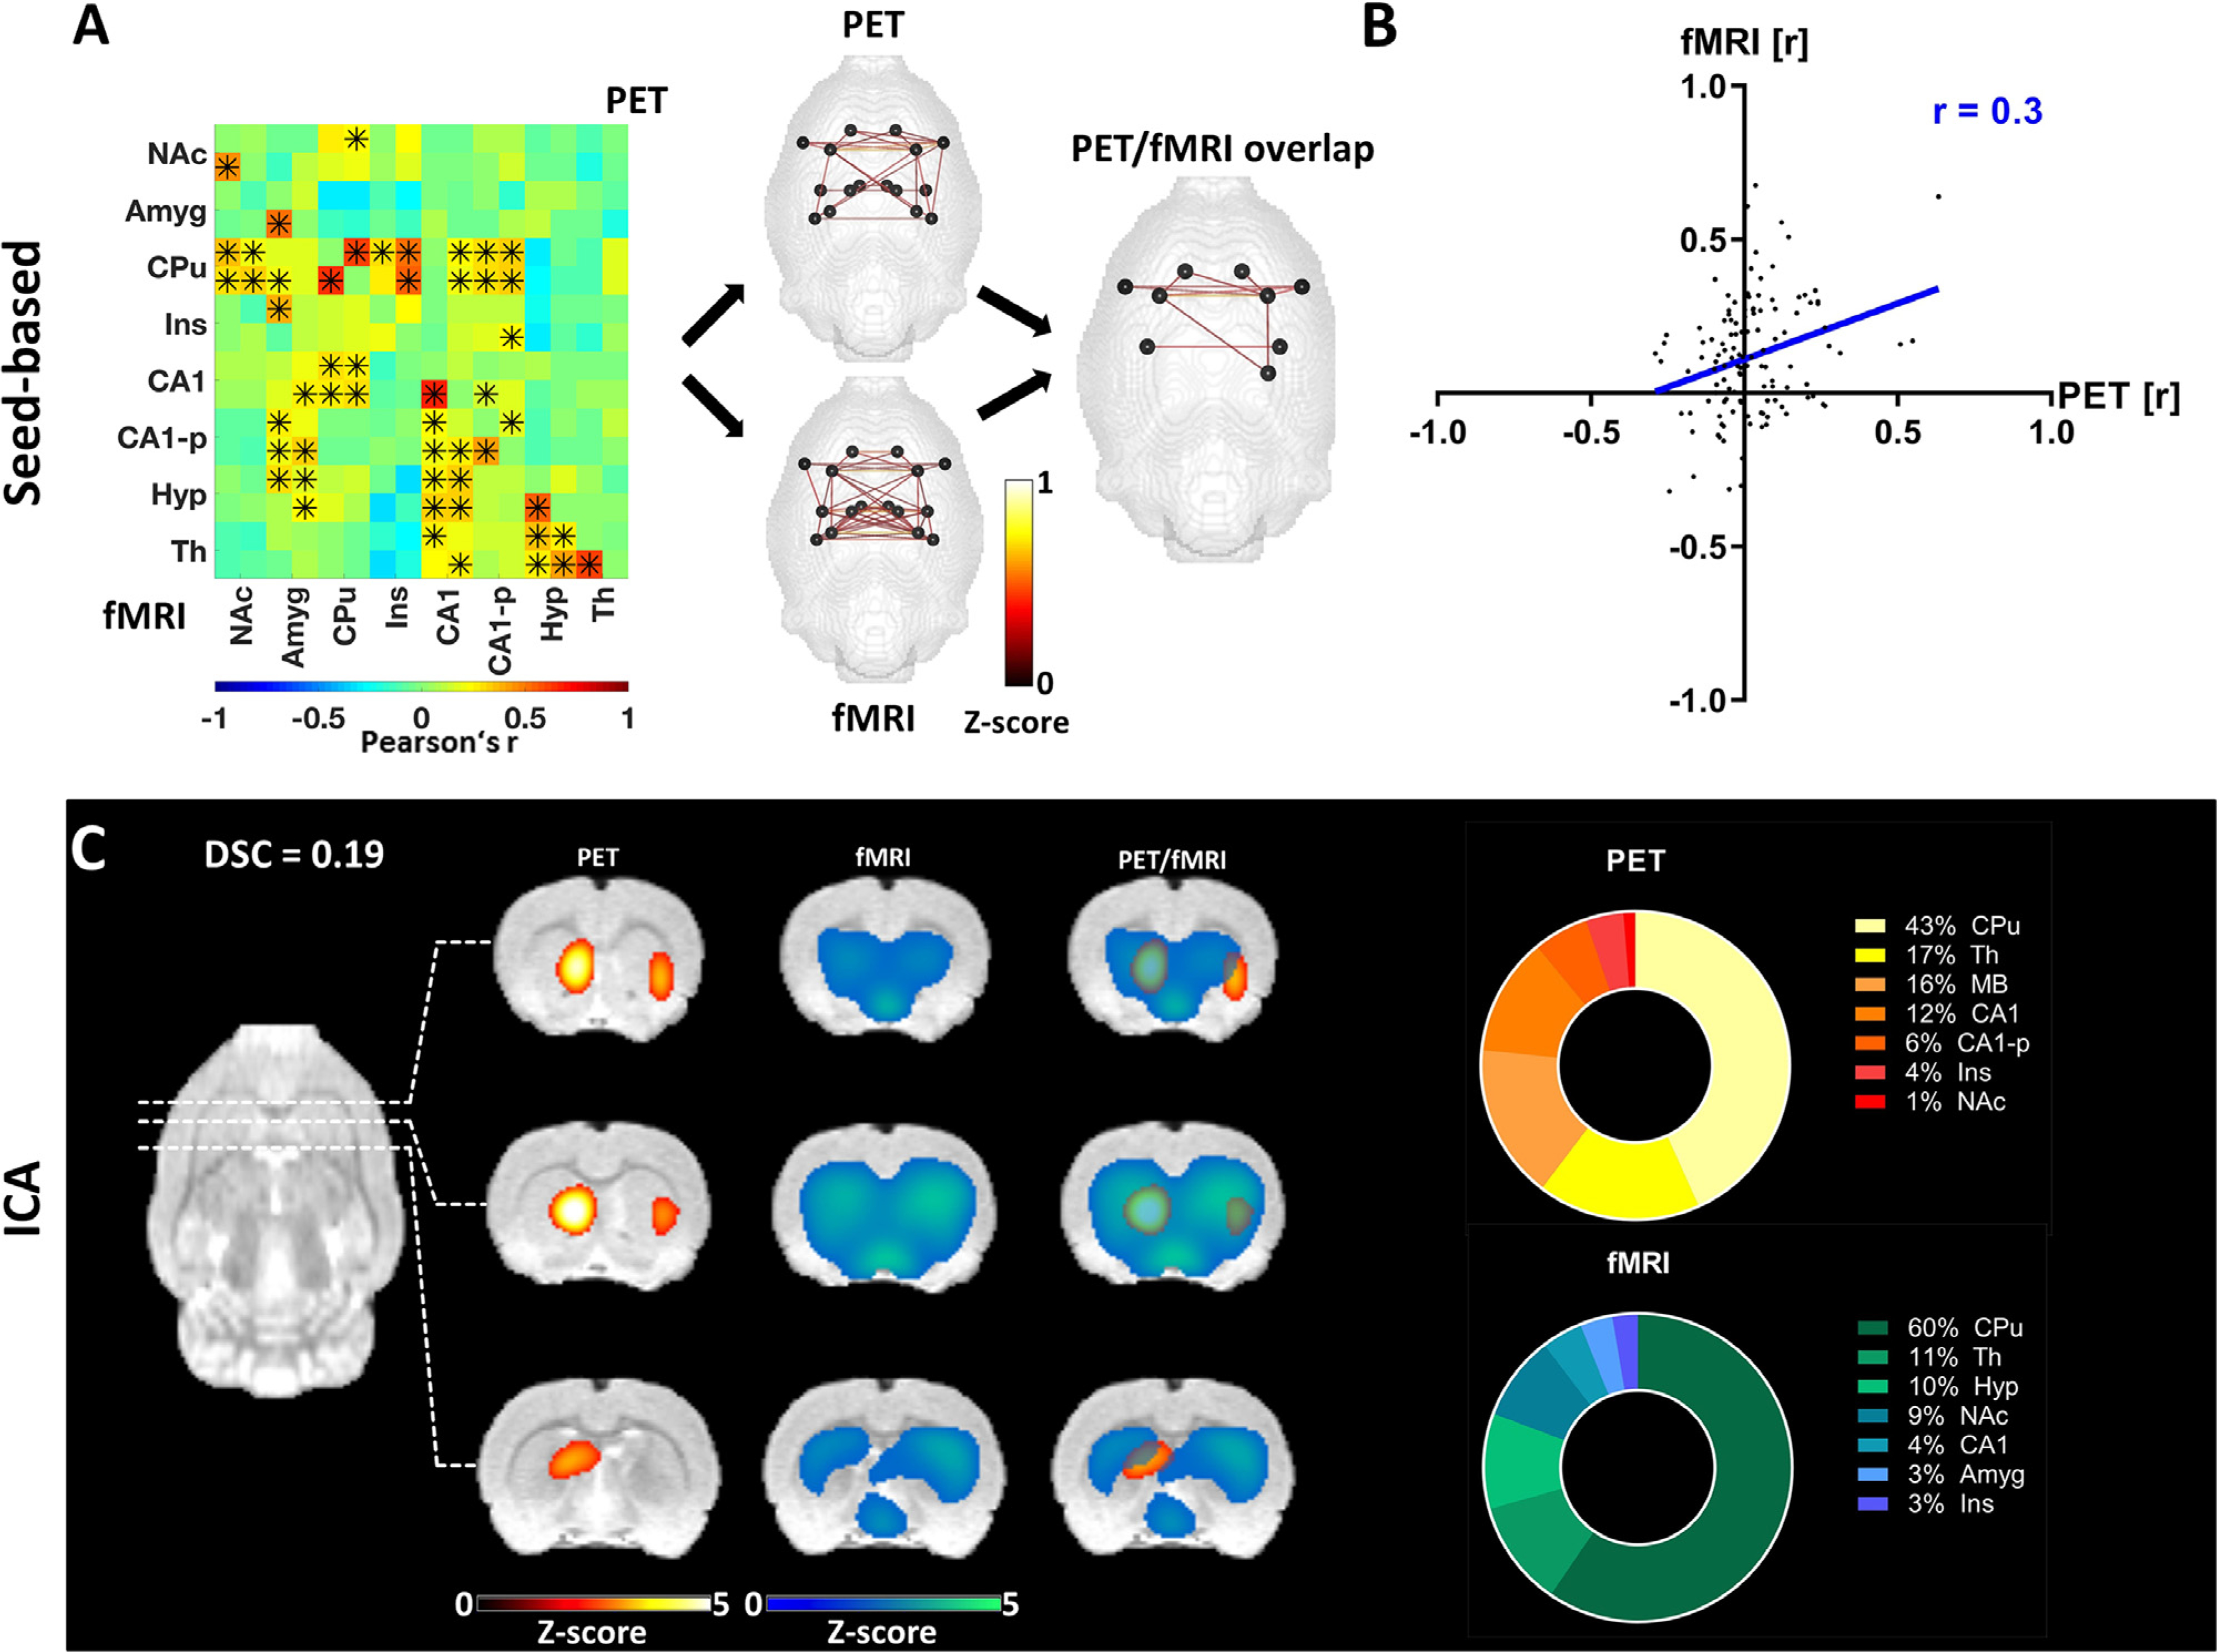
Fig. 3.

Pairwise correlation analysis and ICA-derived connectivity of the basal ganglia network. (A) Mean connectivity matrix of the basal ganglia network for [18F]FDG and BOLD-fMRI. The positive edges derived from a whole-brain sparsity threshold of 20% are depicted along with the common edges for both methods. * indicate significant correlations (p ≤ 0.05, corrected for multiple comparisons using Bonferroni-Holm). (B) Correlation of [18F]FDG connectivity and FC within the basal ganglia assessed using Pearson’s r. (C) ICA-derived components of [18F]FDG connectivity and FC comprising regions associated with the basal ganglia network along with their overlap (z ≥ 1.96) and the percentage contribution of different regions to the ICA-derived components. The results are reported at group-mean level (n = 30). FC = fMRI-derived functional connectivity, ICA = independent component analysis, DSC = Dice-Sörensen coefficient. For a list of abbreviations of all regions, please refer to Supplementary Table 1.
