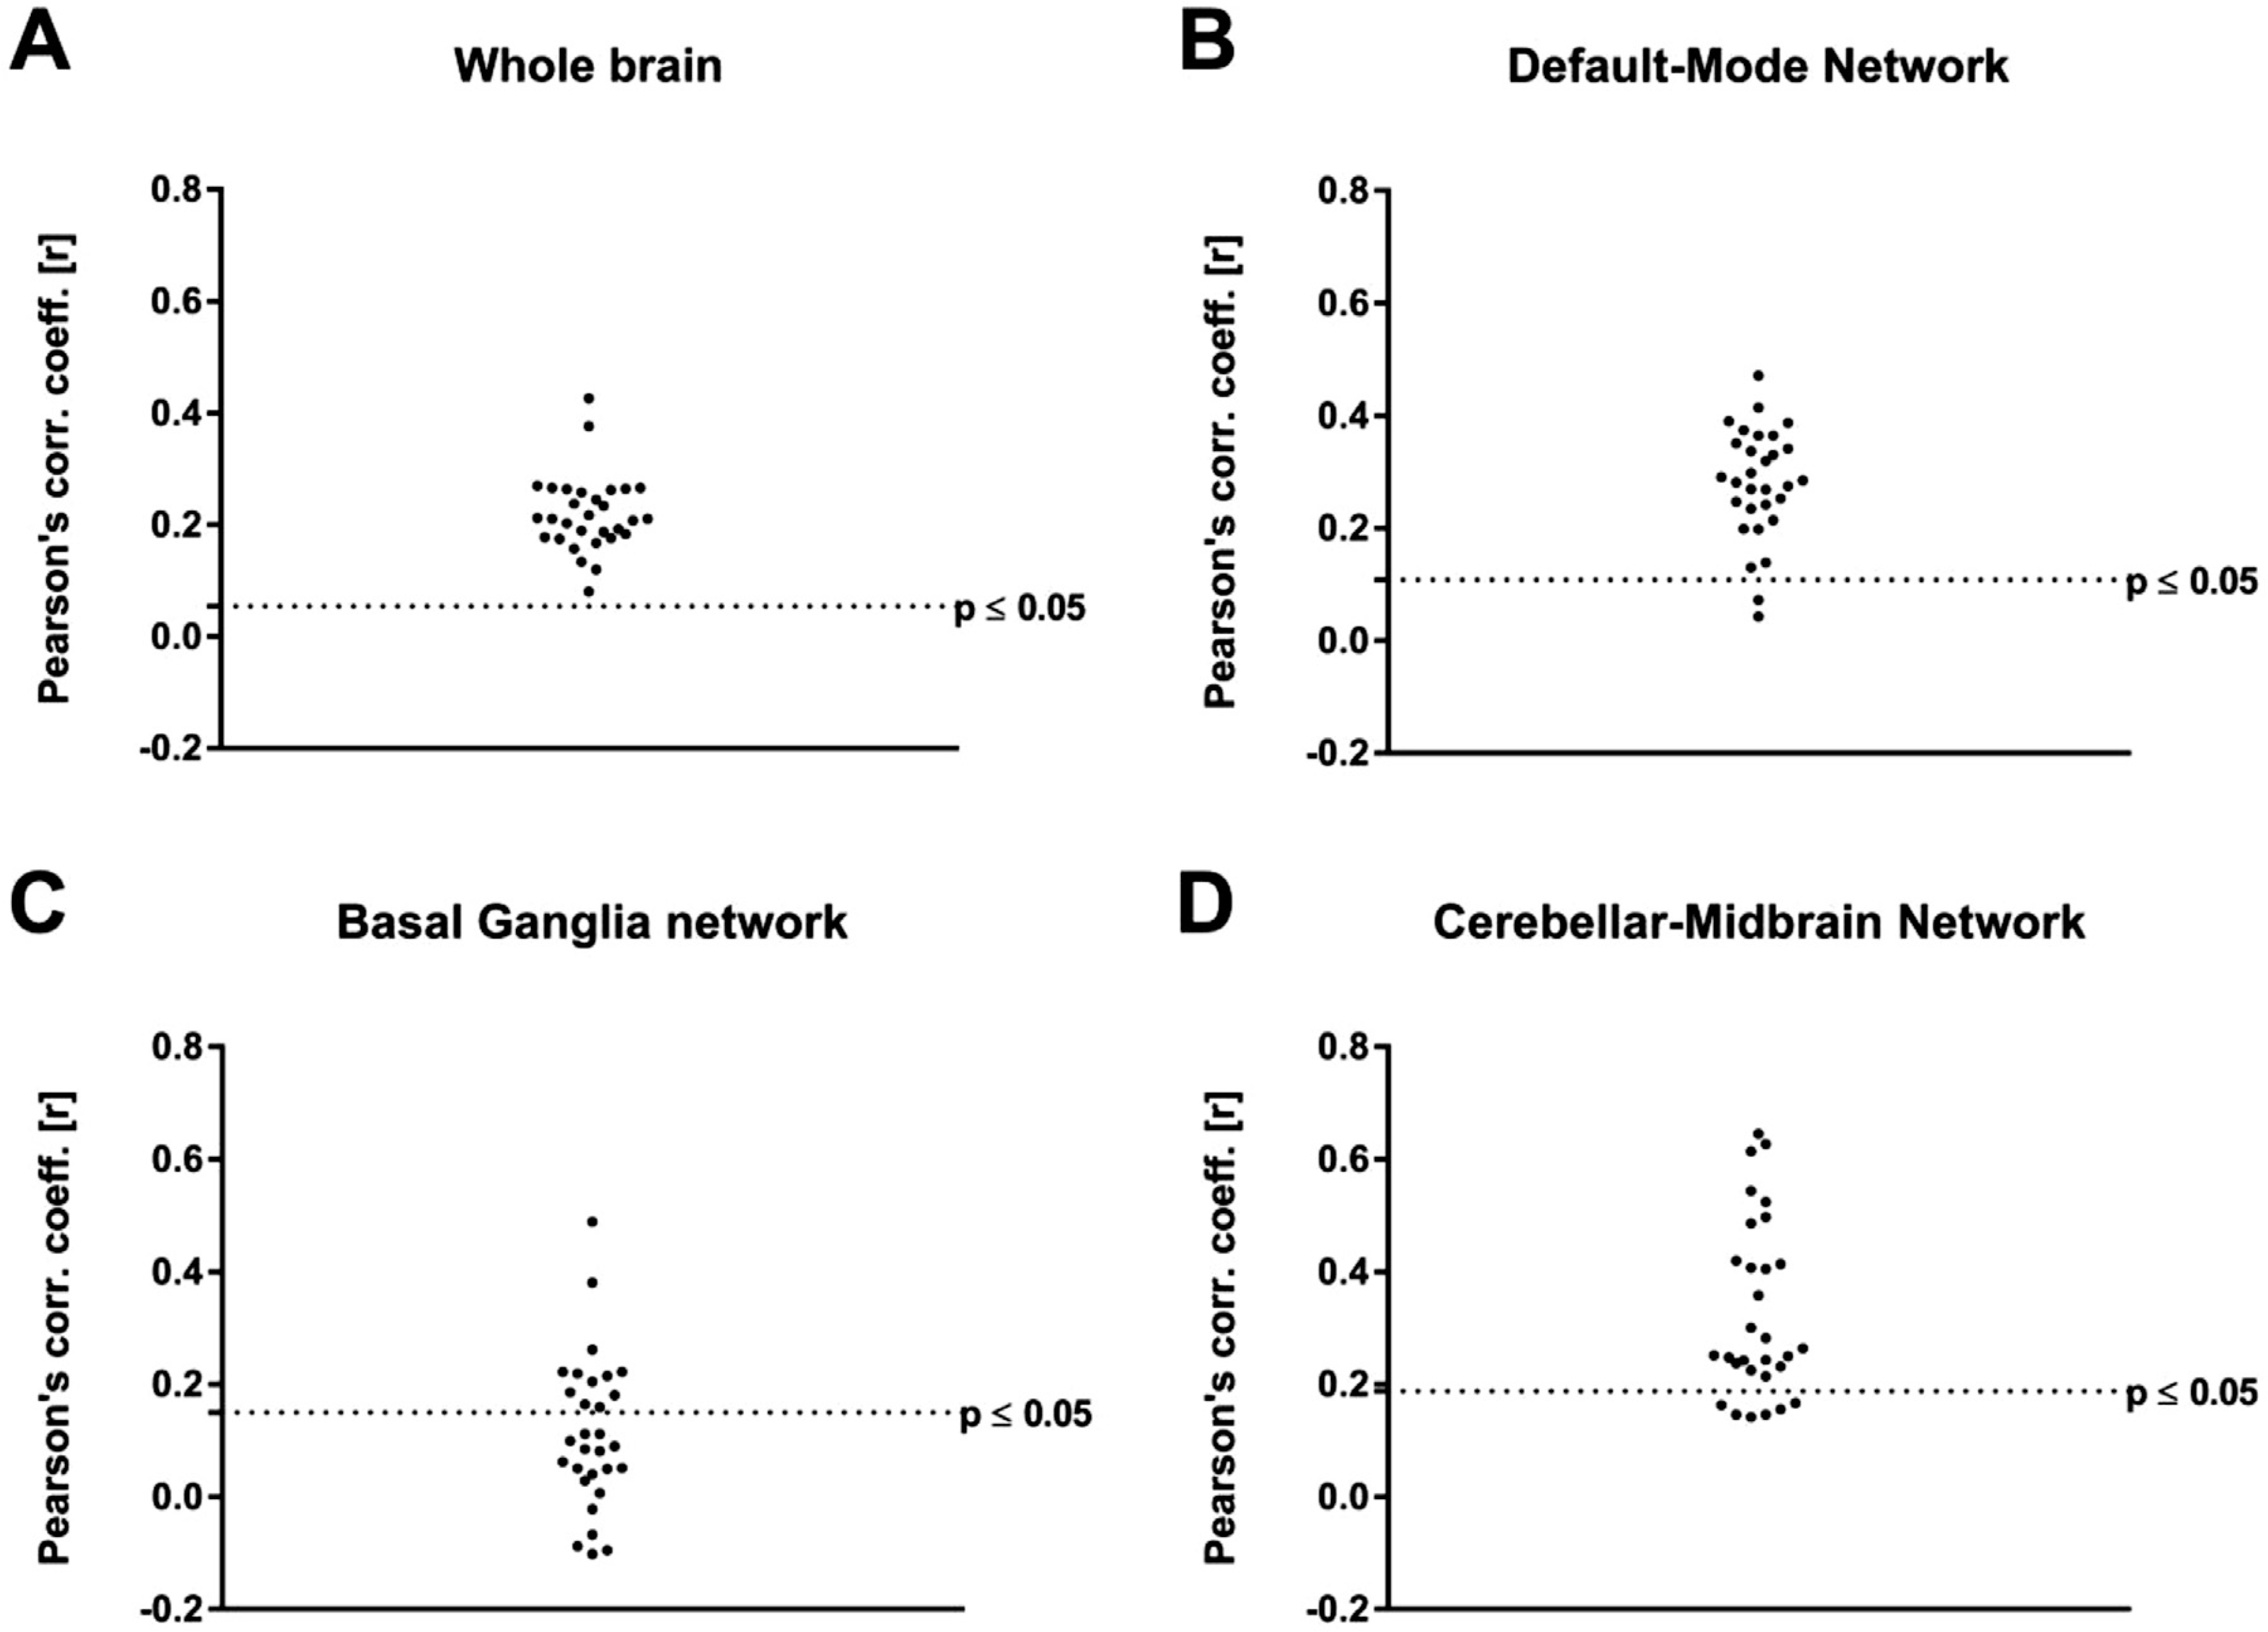
Fig. 5.

Correlations between the [18F]FDG and BOLD-fMRI readouts on single-subject level for every RSN. The subject-level correlations were tested for significance (A) at whole-brain level and in the (B) default-mode network, (C) basal ganglia network and (D) cerebellar-midbrain network with and without multiple comparison corrections. The dotted lines indicate significance without multiple comparison correction (p ≤ 0.05).
