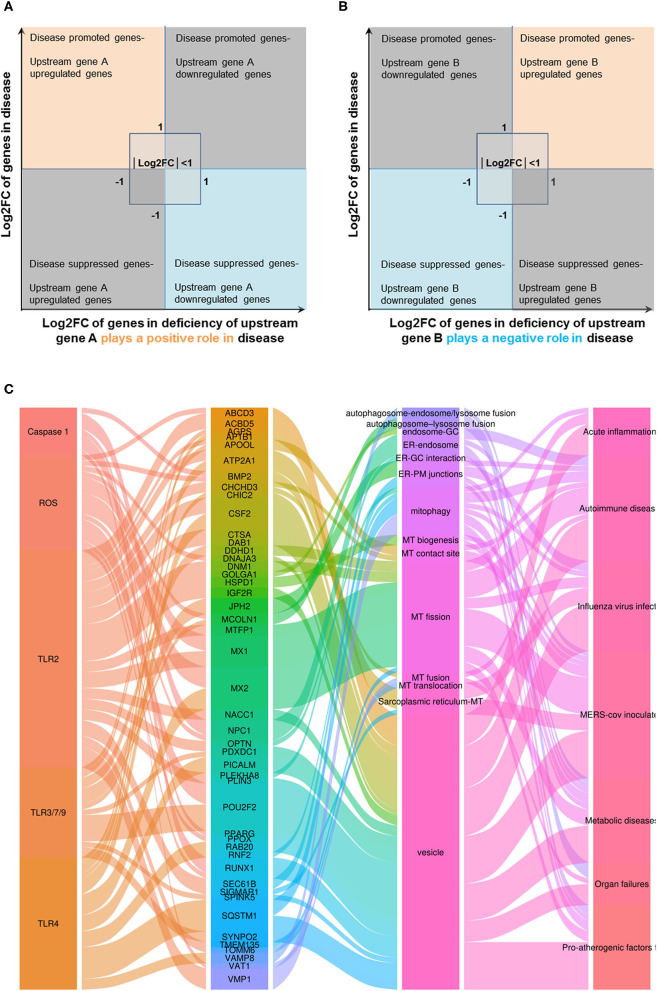
Figure 9.
Three types of regulators (TLRs, caspase-1, and ROS regulators) upregulated a total of 46 OCRGs in different diseases, and virus- and pro-atherogenic factor-treated cells. (A) Two models were used to explore the mechanisms of expression changes of OCRGs in the upstream gene-deficient microarrays. When the upstream gene A plays a positive role (promote disease) in disease (or in virus, pro-atherogenic DAMP-treated cells), OCRGs upregulated in the disease will be downregulated in deficiency of upstream gene A (upper left box). OCRGs downregulated in the disease will be upregulated in deficiency of upstream gene A (bottom right box). (B) When the upstream gene B plays a negative role (suppress disease) in disease (or in virus, pro-atherogenic DAMP-treated cells), OCRGs upregulated in the disease will be upregulated in deficiency of upstream gene B (upper right box). OCRGs downregulated in the disease will be downregulated in deficiency of upstream gene B (bottom left box). (C) Alluvial plot shows the regulated 46 OCRGs by TLR2, TLR4, TLR3/7/9, caspase-1, and ROS regulator Nrf2; and these 46 OCRGs classified 14 groups of all 16 groups (except for MT fission and fusion, and ER–MT contact OCRGs), and vesicle, MT fission, and mitophagy are the top 3 groups. TLR2 regulated 24 OCRGs and caspase-1 regulated five OCRGs. Twelve OCRGs (i.e., CSF2, MX1, ABCD3, ATP2A1, APOOL, PDXDC1, MX2, CSF2, POU2F2, MCOLN1, NPC1, RUNX1, and BMP2) were regulated by two upstream regulators; other OCRGs were regulated by one upstream regulator. The regulated OCRGs were more in autoimmune diseases and virus-infected cells than in other diseases. Alluvial plot was plotted by http://www.bioinformatics.com.cn, an online platform for data analysis and visualization. The detailed relation between OCRGs and upstream regulators is listed in Supplementary Table 10.

