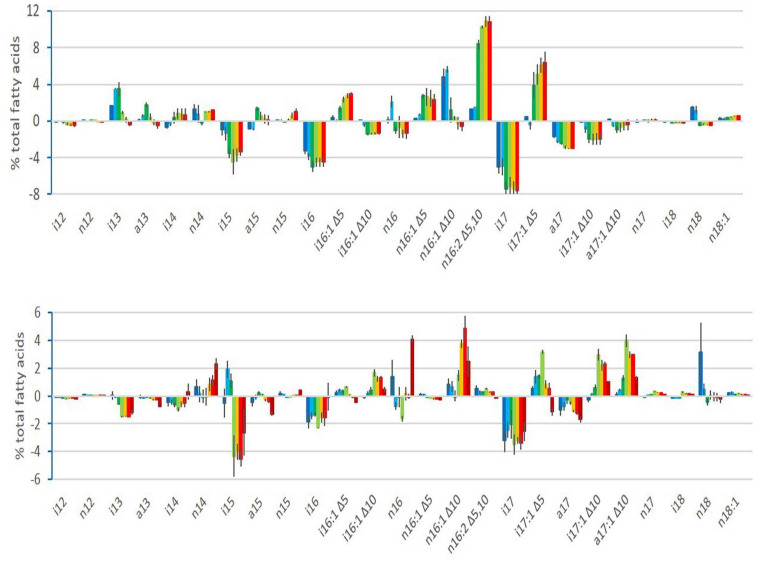
FIGURE 2.
Changes in relative abundance (%) of fatty acids during growth of B. cereus strain ATCC 10876 at cold temperature (12°C, upper panel) and warm temperature (30°C, lower panel), relatively to the inoculum. Bars represent mean of three independent experiments and present for each growth time fatty acid relative abundance minus fatty acid relative abundance of inoculum. Lines over or below bars are standard deviations. For each fatty acid, growth times were, from left to right, 3, 7, 24, 48, 72, and 96 h at 12°C and 0.5, 1, 2, 4, 6, 7, and 24 h at 30°C. Colors ranged from dark blue for first sampling time to red for sixth (brown for the seventh at 30°C) sampling time.

