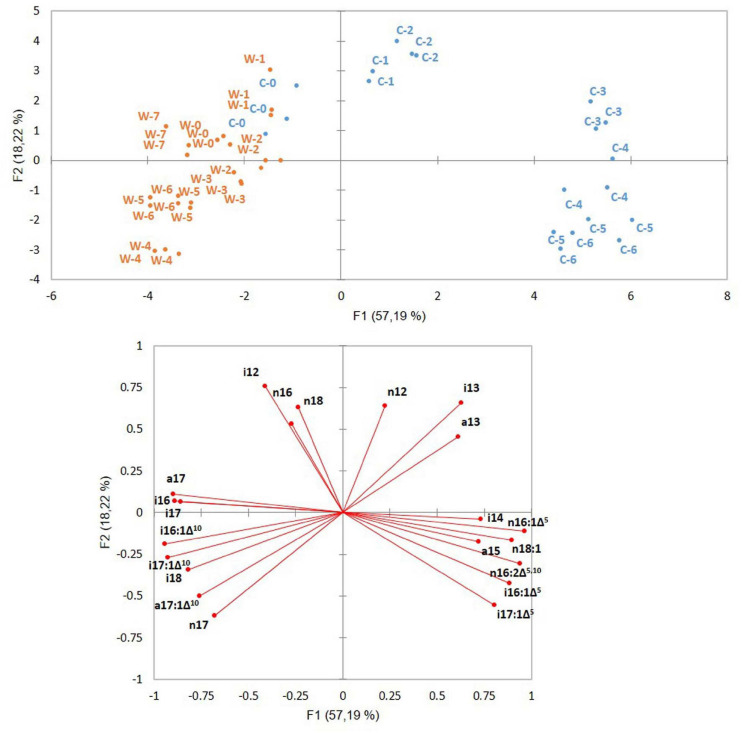
FIGURE 3.
Principal component analysis of B. cereus ATCC 10876 samples grown at warm (W) and cold (C) temperatures. Samples were grown for 0, 3, 7, 24, 48, 72, and 96 h at cold (corresponding to samples C0 to C6, blue points) and 0, 0.5, 1, 2, 4, 6, 7, and 24 h at warm temperatures (corresponding to samples W0 to W 7, orange points). Inoculum at both cold (C0) and warm (W0) growth experiments were grown at a warm temperature. Distribution of samples (upper panel) and position of variables (lower panel). Variables were relative abundances of fatty acids.

