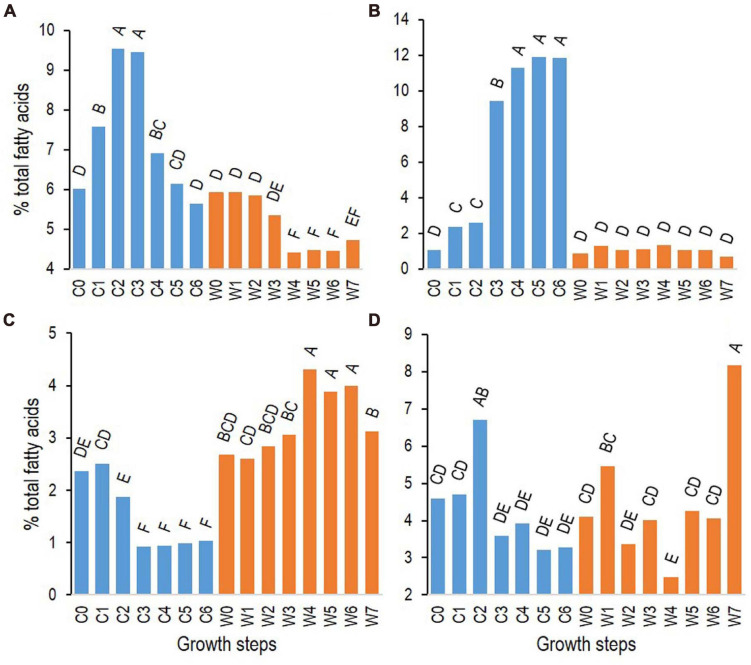
FIGURE 5.
Changes of relative abundance at cold (12°C, C0–6, blue bars) and warm (30°C, W0–7, orange bars) temperatures of fatty acids with representative patterns of changes (see Table 2): i13 (A), n16:2 Δ5,10 (B), i16:1 Δ10 (C), and n16 (D). Results presented are from B. cereus strain ATCC 10876. Growth times C0–6 and W0–7 correspond to, respectively, 0, 3, 7, 24, 48, 72, and 96 h and 0, 0.5, 1, 2, 4, 6, 7, and 24 h. Results are mean of three independent experiments. In each panel, bars sharing same letter are not significantly different according to Tukey’s honest significant difference test at the 5% level.

