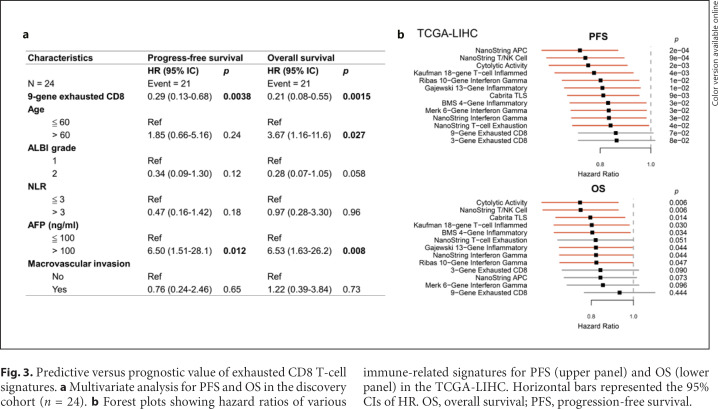
Fig. 3.
Predictive versus prognostic value of exhausted CD8 T-cell signatures. a Multivariate analysis for PFS and OS in the discovery cohort (n = 24). b Forest plots showing hazard ratios of various immune-related signatures for PFS (upper panel) and OS (lower panel) in the TCGA-LIHC. Horizontal bars represented the 95% CIs of HR. OS, overall survival; PFS, progression-free survival.

