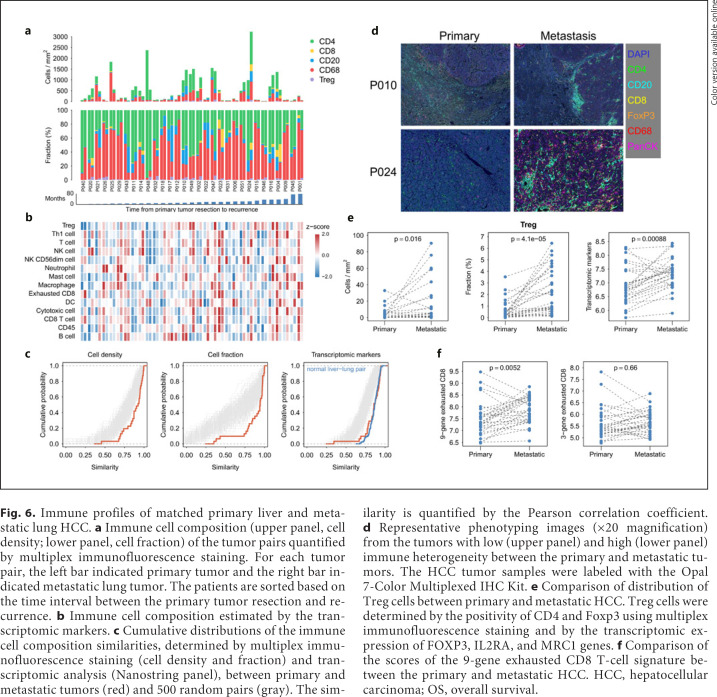
Fig. 6.
Immune profiles of matched primary liver and metastatic lung HCC. a Immune cell composition (upper panel, cell density; lower panel, cell fraction) of the tumor pairs quantified by multiplex immunofluorescence staining. For each tumor pair, the left bar indicated primary tumor and the right bar indicated metastatic lung tumor. The patients are sorted based on the time interval between the primary tumor resection and recurrence. b Immune cell composition estimated by the transcriptomic markers. c Cumulative distributions of the immune cell composition similarities, determined by multiplex immunofluorescence staining (cell density and fraction) and transcriptomic analysis (Nanostring panel), between primary and metastatic tumors (red) and 500 random pairs (gray). The similarity is quantified by the Pearson correlation coefficient. d Representative phenotyping images (×20 magnification) from the tumors with low (upper panel) and high (lower panel) immune heterogeneity between the primary and metastatic tumors. The HCC tumor samples were labeled with the Opal 7-Color Multiplexed IHC Kit. e Comparison of distribution of Treg cells between primary and metastatic HCC. Treg cells were determined by the positivity of CD4 and Foxp3 using multiplex immunofluorescence staining and by the transcriptomic expression of FOXP3, IL2RA, and MRC1 genes. f Comparison of the scores of the 9-gene exhausted CD8 T-cell signature between the primary and metastatic HCC. HCC, hepatocellular carcinoma; OS, overall survival.

