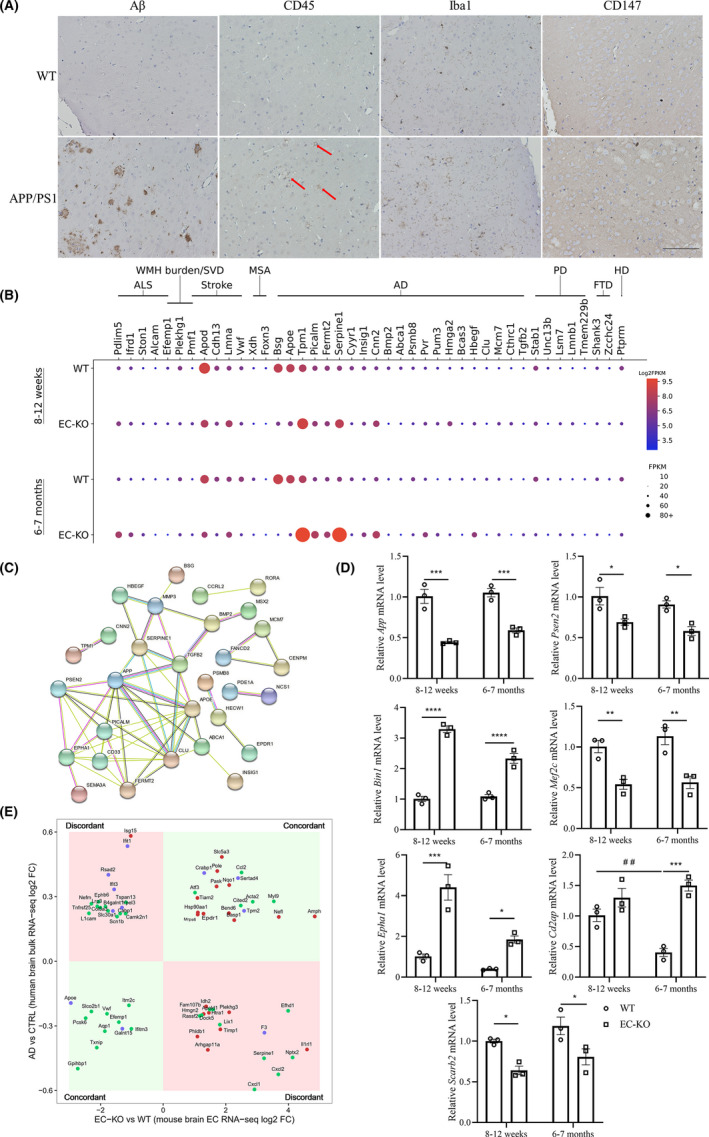
FIGURE 6.

Disease‐related transcriptomic changes in EC‐KO. (A) IHC staining of Aβ, CD45, Iba1, and CD147 in 18‐month‐old APP/PS1 mouse brain slices and peer comparisons. Scale bar: 100 μm (B) The expression of DEGs whose human orthologs are related to neurodegenerative and cerebrovascular diseases in GWAS datasets, expression is represented as FPKM. Disease abbreviations: ALS, amyotrophic lateral sclerosis; WMH burden/SVD, white matter hyperintensity burden and cerebral small vessel disease; MSA, multiple systems atrophy; AD, Alzheimer's disease; PD, Parkinson's disease; FTD, frontotemporal dementia; HD, Huntington's disease. There were 21 DEGs related to AD (p = 0.00266). (C) Visual PPI network of the AD‐related dataset. The edges between nodes represent different protein–protein associations, including experimental determination (purple), interactions from current databases (blue), and coexpression (black). (D) Expression changes of selected genes (App, Psen2, Epha1, Cd2ap, Bin1, Mef2c, Scarb2) by RT‐qPCR. Data are presented as the mean ± SEM of three independent experiments. *p < 0.05, **p < 0.01, ***p < 0.001, and ****p < 0.0001. (E) Human AD brain differential expression versus the control (p < 0.05) served as the y‐axis, and DEGs (fold change ≥2 with FDR‐adjusted p < 0.05) from EC‐KO mice versus WT mice served as the x‐axis. The genes and their human orthologs were concordant in the first and third quadrants (light green), whereas they were discordant in the second and fourth quadrants (light red). Twenty‐one DEGs were specific in the groups compared at 8–12 weeks of age (red dot, EC‐KO versus WT), and 35 DEGs were specific in the groups compared at 6–7 months of age (green dot), whereas 11 DEGs were shared (blue dot) in both groups
