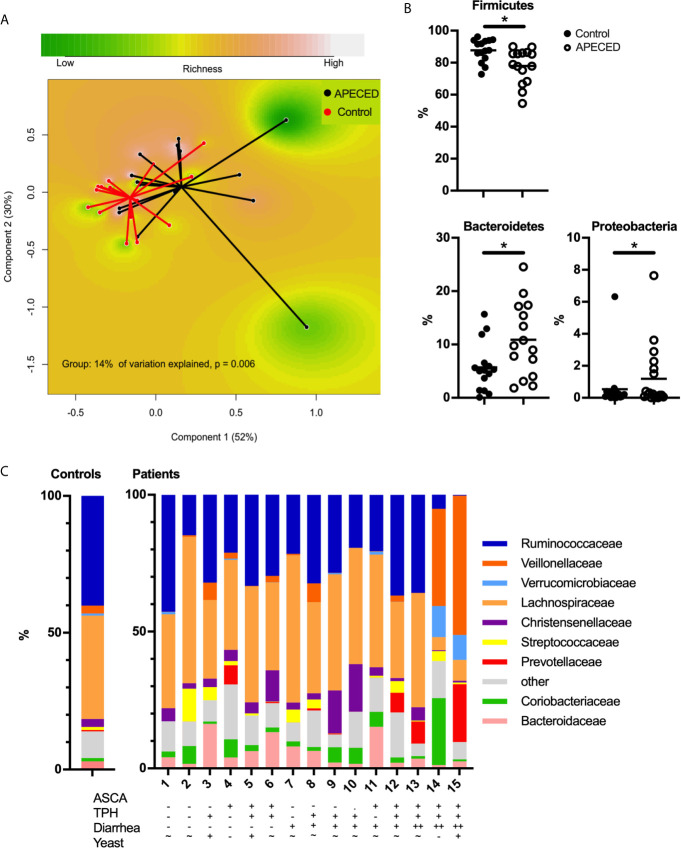
Figure 1.
(A) Principal coordinate analysis (PCoA) based on Bray–Curtis distances using the phylum-level data showing differences in the gut microbiota compositions between patients with APECED (black) and healthy controls (red). (B) The relative abundances of Firmicutes, Bacteroidetes and Proteobacteria in patients with APECED (open circles) compared to healthy controls (black circles). * indicates FDR-P-value < 0.05 (C) Composition of the gut microbiota at the family level of patients with APECED and healthy controls. For readability, the composition of the controls is shown as mean relative abundance. Anti-Saccharomyces cerevisiae antibodies (ASCA), antibodies against tryptophan hydroxylase (TPH), gastrointestinal symptoms and results of stool yeast analysis are shown for each patient. – negative/low, + positive, ++ markedly positive i.e. severe symptoms, ~ average.

