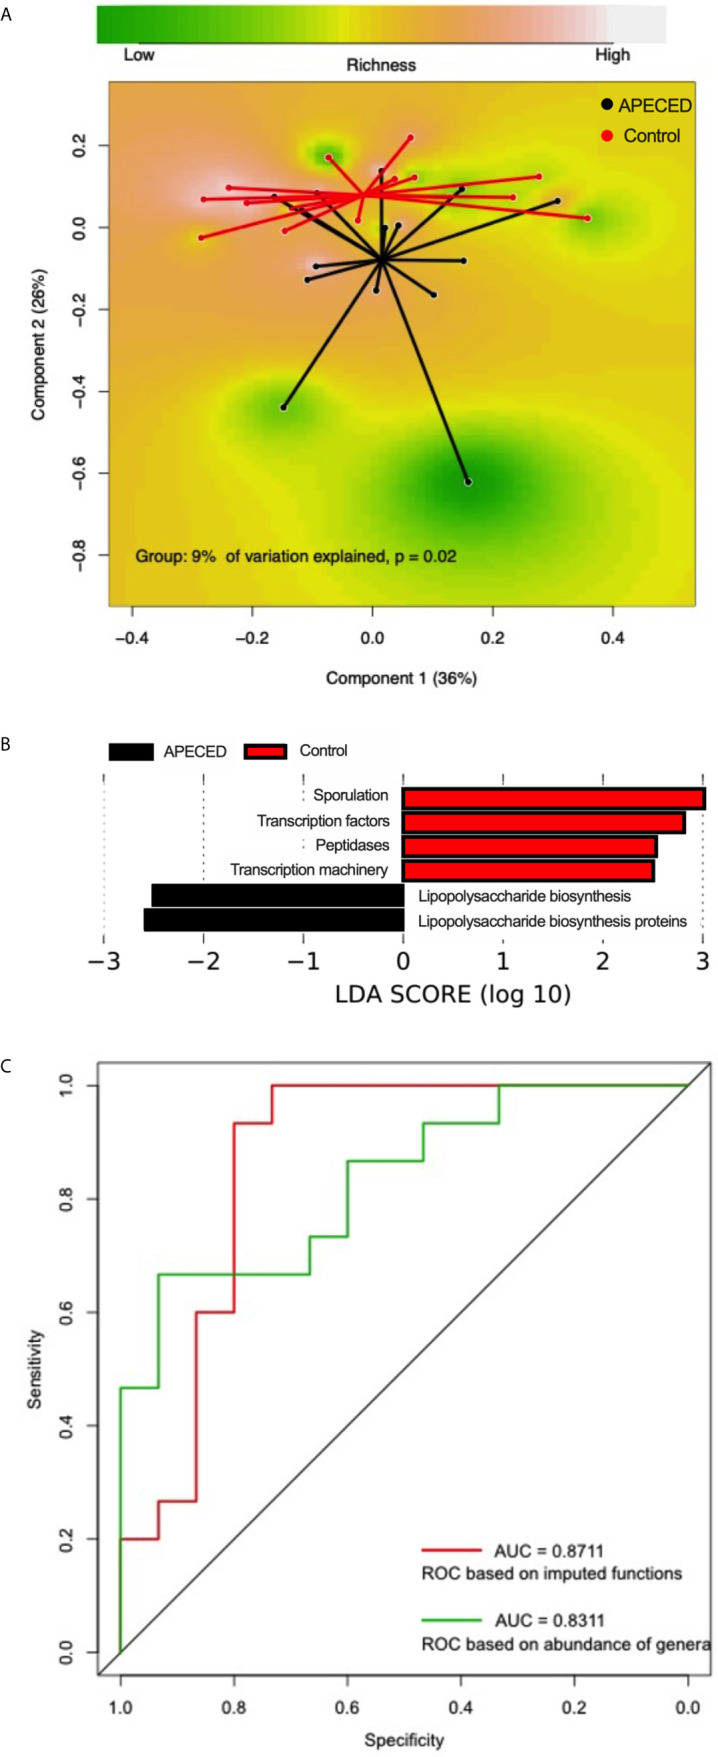
Figure 3.

(A) Principal coordinate analysis (PCoA) based on Bray–Curtis distances using the predicted functional modules showing differences in the gut microbiota compositions between patients with APECED (black) and healthy controls (red). (B) Predicted functional modules significantly overrepresented in patients with APECED (black) and controls (red). (C) Receiver operating characteristic (ROC) curves of the cross-validated random forest models constructed using the imputed functions (red) and relative abundances of genera (green).
