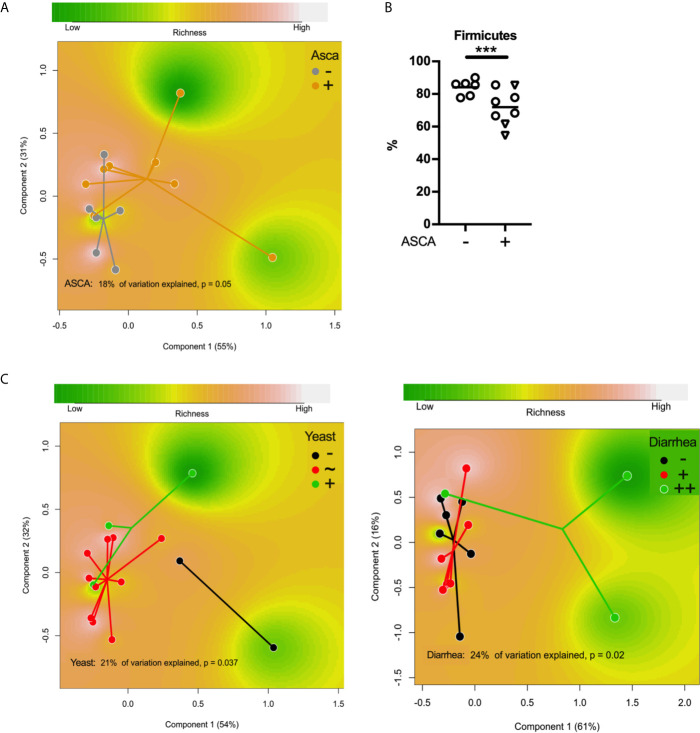
Figure 4.
(A) Principal coordinate analysis (PCoA) based on Bray–Curtis distances using the phylum-level data showing differences in the gut microbiota compositions between ASCA-positive and ASCA-negative patients with APECED. (B) The relative abundance of Firmicutes in patients with or without ASCA. (C)Principal coordinate analysis (PCoA) based on Bray–Curtis distances using the genus-level data showing differences in the gut microbiota compositions between patients with APECED ranked according to abundance of yeast in stool and the severity of patient’s gastrointestinal symptoms, respectively. *** denotes p-value < 0.001; –, negative/low; +, positive; ++, markedly positive ie. severe symptoms; ~, average.

