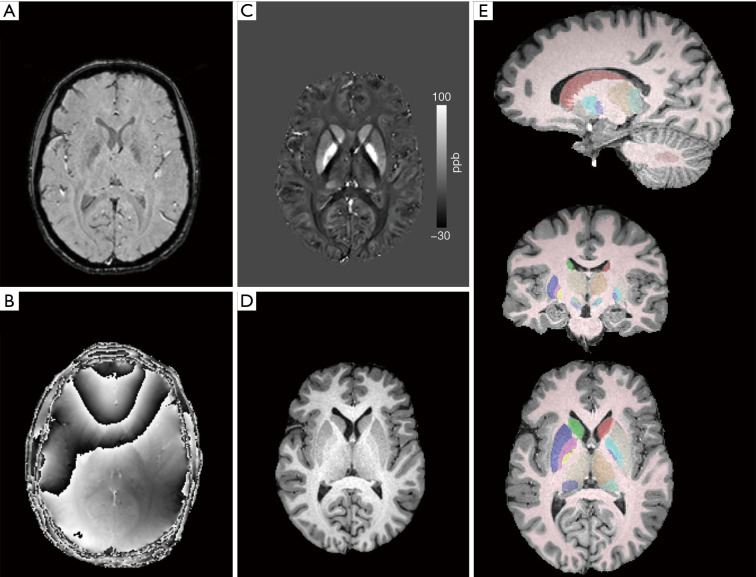
Figure 1.
Illustration of MRI data processing. Example (A) magnitude and (B) raw phase (TE =24.5 ms) GRE images; (C) reconstructed QSM image and (D) corregistered skull-stripped T1-weighted anatomical image that were used for automatic multiatlas segmentation; (E) automatically segmented regions of interest overlaid onto anatomical image. ppb, parts per billion; GRE, gradient recalled echo; TE, echo time; QSM, quantitative susceptibility mapping.

