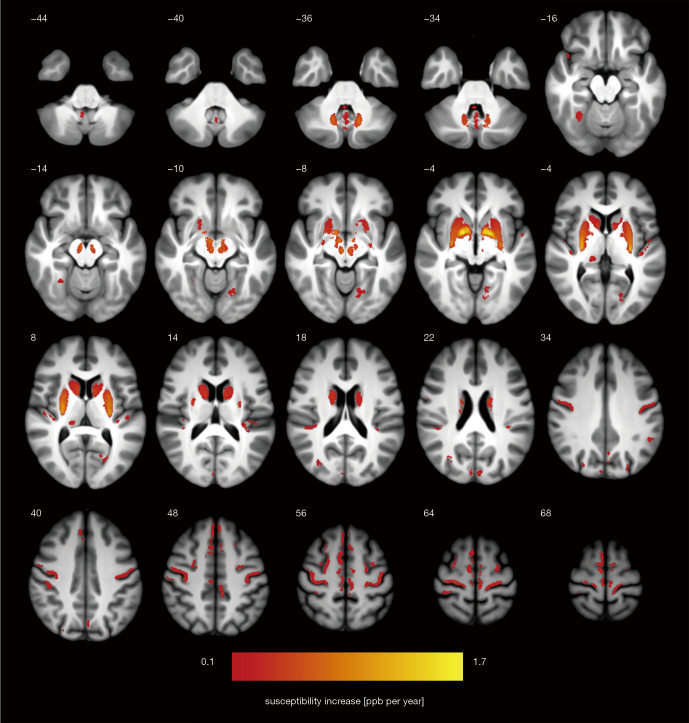
Figure 3.
Statistical map of age-related susceptibility changes in the brain of normal adults represented as mean bulk susceptibility increase in ppb per year (thresholded at P<0.05 at cluster level and corrected for family-wise error; initial cluster definition threshold was set to P<0.005 uncorrected). Z-coordinate in the MNI space in [mm] is indicated for each slice. ppb, parts per billion; MNI, Montreal Neurological Institute.

