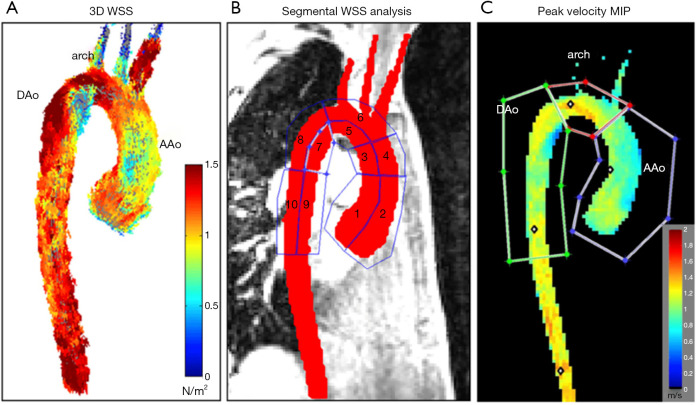
Figure 4.
Segmental WSS and peak velocity of aorta. (A) 3D WSS across the entire aortic surface; (B) ten areas applied to segment WSS throughout aorta; (C) peak systolic velocity maximum intensity projection. WSS, wall shear stress; AAo, ascending aorta; DAo, descending aorta; MIP, minimum intensity projection (32).

