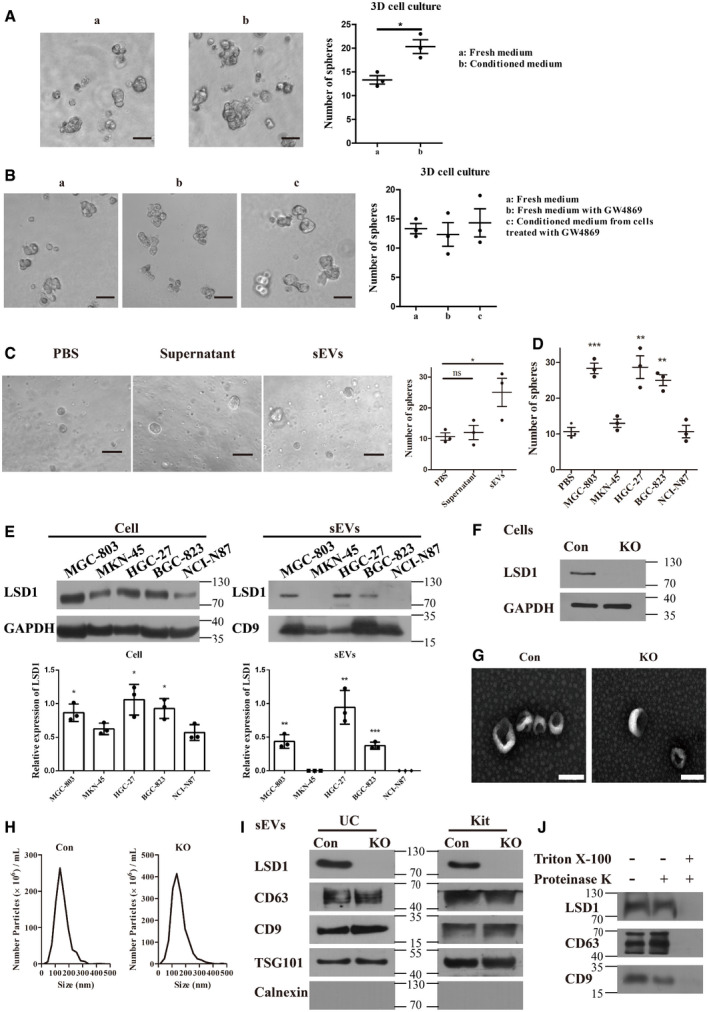
Figure 1. LSD1 is secreted from gastric cancer cells through small extracellular vesicles (sEVs).

-
ASphere formation in MGC‐803 cells incubated with fresh medium or conditioned medium from MGC‐803 cells for 7 days. The number of spheres was quantified and indicated on the right. Scale bar = 100 µm (n = 3 biological replicates; mean ± standard error of mean (SEM); *P = 0.0146; two‐tailed unpaired Student’s t‐test).
-
BSphere formation in MGC‐803 cells with indicated treatment. The number of spheres was quantified and indicated on the right. Scale bar = 100 µm (n = 3 biological replicates; mean ± SEM; no significant differences; two‐tailed unpaired Student’s t‐test).
-
CSphere formation in MGC‐803 cells incubated with an equal volume of phosphate‐buffered saline, supernatant after differential centrifugation, or sEVs. Scale bar = 100 µm (n = 3 biological replicates; mean ± SEM; ns, no significant difference; *P = 0.0390; two‐tailed unpaired Student’s t‐test).
-
DSphere formation in MGC‐803 cells treated with sEVs (20 μg/ml) from five gastric cancer cell lines as indicated (n = 3 biological replicates; mean ± SEM; ***P = 0.0007 (MGC‐803), **P = 0.0061 (HGC‐27), and **P = 0.0018 (BGC‐823); two‐tailed unpaired Student’s t‐test).
-
EExpression levels of LSD1 in MGC‐803, MKN‐45, HGC‐27, BGC‐823, and NCI‐N87 cell lines and their corresponding sEVs. The samples with equal amounts of proteins were loaded (n = 3 biological replicates; mean ± SEM; compared with the NCI‐N87; *P = 0.0432 (cell/MGC‐803), *P = 0.0300 (cell/HGC‐27), **P = 0.0306 (cell/BGC‐823), **P = 0.0018 (sEVs/MGC‐803), **P = 0.0029 (sEVs/HGC‐27), and ***P = 0.0003 (sEVs/BGC‐823); two‐tailed unpaired Student’s t‐test; GAPDH was used as a loading control for cell lysis; CD9 was used as a loading control for sEV lysis).
-
FEstablishment of LSD1 knockout (KO) MGC‐803 cell line. Con indicates MGC‐803 cells, while KO indicates LSD1 KO MGC‐803 cells.
-
G, HTransmission electron microscopy images (G) and the size distribution (H) of sEVs from MGC‐803 and LSD1 KO MGC‐803 cells. Scale bar = 100 nm.
-
IExpression levels of LSD1, CD63, CD9, TSG101, and calnexin in sEVs from MGC‐803 and LSD1 KO MGC‐803 cells. sEVs were extracted using two different extraction methods (ultracentrifugation (UC) and commercial kit). Calnexin is an sEV negative marker. UC, sEVs isolated using the ultracentrifugation method; Kit, sEVs isolated using the commercial kit.
-
JExpression levels of LSD1, CD63, and CD9 in sEVs with indicated treatment.
Source data are available online for this figure.
